Quite often edtech tools are used by the teacher rather than the students and don’t do much more than make things prettier.
Think: Teacher at Smartboard as replacement for the overhead.

New digital technologies allows us to “see” information in new ways.
Think: Students analyzing a text using Wordle
History and other humanities that tended to be strictly narrative are leveraging data collection and display tools to spawn a new digital / data approach to teaching history and social science.
See Digital Humanities Projects at Stanford
Many apps and websites can be a great tool to introduce the research method – form a hypothesis, gather and analyze data, revise hypothesis (as needed), draw conclusions, assess research methods. Working in teams students can easily pose research questions, run the data, revise and assess their research strategy. Students can quickly make and test predictions. They can then present and defend their conclusions to other classroom groups. All skills called for by the new Common Core standards.
In today’s class we will explore a sampling of free online data visualization tools that can be used in the classroom. Students will be asked to incorporate one of these tools into a lesson design.
Data-based tools
- GapMinder World – manipulate moving bubble graphs, select x and y axis from a variety of data sets [My low-tech version from 1995]
Text-based tools
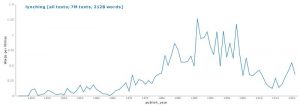
- NGram Viewer – online research tool that allows you to quickly analyze the frequency of names, words and phrases -and when they appeared in the Google digitized books. For more advanced searches using NGram Viewer click here.
- Google Trends – see how often specific keywords, subjects and phrases have been queried over a specific period of time.
- The State of the Union in Context– compare use of words by different Presidents
- Movies – dialogues of movie and TV shows
Map-based tools
- Timelapse – is a global, zoomable video that lets you see how the Earth has changed over the past 32 years.
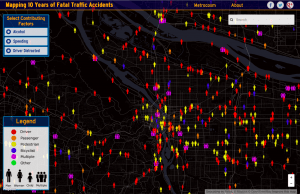
- Metrocosm – All the World’s Immigration Visualized in 1 Map
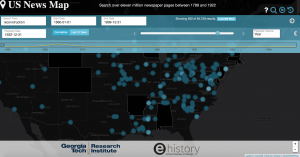
- MapJunction – Compare US city maps over time
- Map of White Supremacy mob violence
- Mapping the “Negro Travelers’ Green Book“
Assignment 9 | Completed work
Choose one or more of these digital tools (or use a favorite of yours) and blog about how you would use it in an activity, lesson or unit. Be sure you focus on an idea that allows your students to be using the tool. Be sure to link to the tool and include a screen shot. If the digital tool allows results to be embedded in the blog. Here’s how to use HTML Snippets.
Image credits:Teaching with a SMART Board / Flickr

