I was lucky enough to be able to test a data-based learning segment on a real live class. It is an 11th grade US History class, and the students were learning about the decade of the 1920’s. The topic of that day’s class was the African American experience in the 20’s; specifically the Great Migration (its causes and effects), and the Harlem Renaissance. Vocabulary and key terms included the farmer’s depression, lynching, race riots, and the KKK.
Often student connect to history via the storytelling aspect. I wanted to strike a balance between taking a look at the meta-data of the time while not losing that sense of personalized history. An educational app called Nearpod provided the perfect platform for such a lecture.
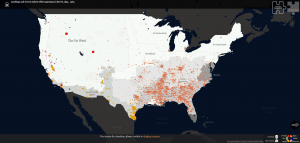
To begin, we took a closer look at the Great Migration. This included some of the hardships faced by those making the journey, some common destinations and regions of origin, etc. When discussing “push factors,” I had students click on the link within the Nearpod app, which each student was using on their own Chromebook, to this website. The website they arrived at contains an interactive map that shows every lynching to have been recorded throughout US history. Students can change the date range, zoom in on specific states, view clusters of attacks categorized as race riots, and discern the race of the victims using a color-coded key.


Students were prompted on how to navigate the site, how to adjust the date range, and what to look for. They were asked questions about what kinds of patterns they observed, etc. It was a stellar opportunity to incorporate higher level thinking questions.
Next, they were asked to discuss collaborate whether,given the circumstances, they would have moved if they were alive at that time. The posts appeared to the class on the projector screen as a bulletin board with their messages posted onto it like notes.
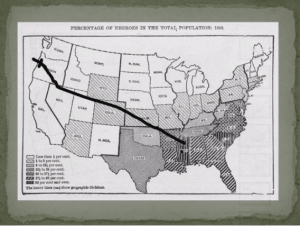
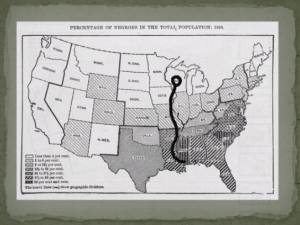
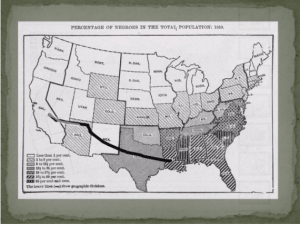
Lastly, students were shown a map of the South prior to 1920, with regions that had a high population of African Americans shaded in darker. They were asked to draw the migration route that they would take if they were plotting their escape. Here are some samples of their work:
This led to a discussion about whether African Americans would have been welcome in Oregon, why they settled in urban centers, and more. Overall, I think the data made a big impression on the students and played a significant role in shaping the lesson as a whole. I look forward to using more meta-data in the future.


David, great integration of multiple sources and perspectives. It turned out well and glad you had a chance to use it with your students.