

Featured Image taken from Griffin Woolridge at Pexels
Backstory:
My mom was born in Oakland in the early 1960’s. Her first home was out near Lake Merritt before her parents decided to move up closer to the Mormon Temple when she was 8. My mom’s parents bought a house on Burdeck Drive, where she would live until she was 12 years old. Their house was beautiful, and was surrounded by massive homes in a very high income area, even during her childhood. When people think of Oakland, their first instinct might be to think about the crime rate, the reality is that Oakland is a beautiful city on the bay. It just so happens to also have a relatively high crime rate. With that said, Oakland, similar to other cities in the Bay Area, has gone through its own share of gentrification, and houses all over the city have skyrocketed in price, even in areas that have historically been known for their high crime rates. Even houses in generally unfavorable areas are worth upwards of $750,000, or even more in some cases.
Unfortunately, the 1940 US census data for Oakland is unfinished at best, and inaccurate at worst. There are streets named incorrectly, houses missing from lists that were verifiably existent during that time, and many other issues. With that said, my mom’s house unfortunately cannot be found on Burdeck Drive (named Burbeck Drive) on the Census. However, there is a house just down the street which can give us an idea of how much Oakland prices have skyrocketed in different areas.
By looking at a Redlining map of 1935-1940’s Oakland, we can get an idea which parts of Oakland have generally been considered favorable to live in, versus unfavorable. For the purposes of comparing two locations, I chose a house down the street from my mom’s home on Burdeck 3216 Burdeck Drive (Section A), and compared it to 1088 88th Avenue (Section D18).
I did some digging on Zillow, as well as other realty sites in hopes of finding some additional information about different homes in Oakland. I wanted to find out why certain houses appreciated more than others, and by how much. I also wanted to compare the incomes of the two locations during the 1935-1940s era, just to give an idea of what types of people would have been living in each of these locations.
Comparing the Houses:
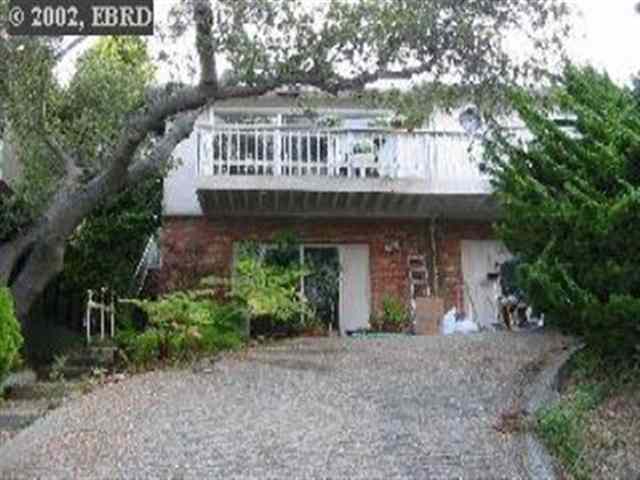
To start with a modern day price, 3216 Burdeck Drive has a Zillow Zestimate of $1,701,100. The house is 3 Bed, 2 Bath and 2,538 Sq. Feet. It is also located in the Oakland Hills, where historically speaking, family incomes have been considerably higher. According to the map, while there is no data on section A, Section A8 had an estimated family income of $6,000-10,000 per year in 1940 which would be worth $111,632- 186,053 in 2021.
Comparing this to 1088 88th Avenue, the house is 3 Bed, 1 Bath and 1,464 Sq. Feet. The house has a Zillow Zestimate of $484,900. The house is considered to be in a Redlined area, which in the case of D18, was known for lower family incomes and higher ethnic minority populations, at least during this time. According to the map, the family incomes in this area averaged $1,200-3200 per year. This would be roughly equivalent to $22,326 – 59,537 in 2021.

By using Realtor.com, you can overlay maps of cities to compare crime, noise, and flood risk. For crime, 1088 88th Avenue is considered to be in an incredibly high crime ridden area, according to these maps. For noise, it is considered to be in a medium noise area. Finally, for flooding, it is at effectively no risk. To compare this to 3216 Burdeck Drive, where the house sits in a low crime zone. In terms of noise, the house is in a medium-low area, and there is also virtually no risk of flooding.
Comparing Incomes:
There is no question about it, the price of 1088 88th Avenue is being affected by factors such as crime and noise. However, this makes you wonder how much. In order to figure this out, I looked back at the 1940 US Census Data to find the specific income of the families who lived in these houses during this time. That way, I can estimate the cost of these houses based on what someone with their income would likely be able to afford.
The income of the family living in 1088 88th Avenue was $900 which is roughly equivalent to $16,745 when accounting for inflation. In 2021, someone with that income could not afford any houses in Oakland. However, the census does state that the individual was a carpenter. By looking up the average wage for a carpenter in 2021, we can better estimate what type of house someone would be able to afford with that occupation. The average carpenter salary is $57,958. With this inference, we can see that carpenters seem to make more money in 2021 than they would have in 1940. With that said, someone with an income of $57,958 in 2021 would be able to afford a house that is worth $241,364.56 according to the HSH “How Much House Can You Afford” calculator. This would suggest that this house has roughly doubled in value since 1940 according to these calculations. The problem with that is the dollar is worth roughly 1/18th what it was worth in 1940, meaning that this house has severely dropped in value since 1940 when accounting for inflation.
When comparing this to the family of 3216 Burdeck Drive, it is a bit more complicated. The owners of the house were a retired Dressmaker and retired Musician. However, their house was estimated to be worth $1,500 according to the 1940 Census Data. This would be worth $27,908 in 2021, meaning that this house effectively multiplied its value by 60.95 times from 1940 to 2021. This is assuming that this is referring to the total value of the home if it were owned, and not the monthly rental value, as $1,500 per month for a rental home back then would have been impossible for most families to afford. While neither of these figures makes complete sense, it seems much more plausible that a house’s value would multiply by 60 times than for someone to be forced to pay the equivalent of nearly $28,000 for rent. This was the figure that was provided, so it is the figure that will be used. It would be difficult to argue any other way, as dressmaking and being a musician both count as private practices, and their incomes are not listed, so it is nearly impossible to estimate the value of the home without the $1500 figure. It is, however, entirely possible that the census is incorrect about the price. Maybe they meant $15,000 which would put the price of the home closer to $279,079 in 2021. This would put the houses’ increase in value at about 6.1 times its original value which is still a pretty significant increase in value.
To summarize, select parts of Oakland have gone through immense gentrification, with an influx of wealth making its way into the Bay Area. Ultimately, while the prices of houses have gone up throughout the city, only certain areas have seen the prices of houses match or even exceed the rate at which inflation is occurring. In the case of 3216 Burdeck Drive, the growth was seemingly astronomical, although almost unbelievably so. For 1088 88th Avenue, the growth was much more modest. This was likely due to the factors such as crime and noise, as well as just how preferable each given area was to live when considering a Redline map.
Chris, congratulations on some first rate research that blends history and economics with a dash of real estate savvy. I like the way you expanded the assignment’s resources to bring in Realtor.com, Zillow and other financial tracking sites. Kudos for thoughtful use of crime, flooding and noice factor maps as well.
You document the connection between Redline status and home value over time. This reinforces the role of federal government housing policy in influencing inter-generational wealth. It also demonstrates how Redline maps overlay other livability indicators over time.
Interesting to see you identified inaccuracies in the 1940 Census. Reminds me of all the concerns about the politicization of the 2020 Census.
Great use of intuition and creativity to fill in the missing pieces to construct a cogent narrative. You should take pride in your research and delivery.
Amazing job with your research, Chris! When I was looking into the Detroit metropolitan area for my research, I noticed that the names of some streets differed between sources. I chalked this up to streets simply being renamed, but since you pointed out many discrepancies in the Census, maybe it’s a similar situation in the Detroit metropolitan area! It also makes me wonder about the overall accuracy of the Census… collecting data on over 100 million people with technology from the 1940s is a tall order!
Once again, great job!