
Context:
While the course work and curriculum in my economics class is graph and figure heavy, I want to work in some more conceptual, practical lessons. Last week when my co-teacher and I began our unit on taxes and W4 forms, we received praise in the Zoom chat for teaching ‘useful concepts’. I love a good supply and demand graph but I think my students have a point – there are concepts in the realm of economics that could really benefit all of them in the near future.
Therefore I have worked on a formative informal assessment embedded in a lesson that is meant to be used on the first or second day of a unit on personal finance and economic decision-making. It is a group simulation intended to introduce students to practical economic decisions they will inevitably make down the line. They will have to think critically about the advantages and disadvantages of a wage versus a salary, modes of transportation and budgeting. As of now, I have designed this lesson to have three groups. The three groups will have three distinct line of works assigned to them.
Guiding Question:
Given the options provided in the Google My Maps and Google Form, what is the most efficient combination of transportation, work and housing for your group’s line of work?
Part 1: Group up and establish a line of work in the Google Form
The class will be randomly split up into three groups each with a different line of work based on their randomly assigned major. There will be different roles assigned once students are in a group. Amongst each group, they will decide their own form scribe, cartographer and bookkeeper. Other group members not assigned a role will help out wherever help is needed – primarily with input on the guiding question of determining the most efficient option. The form scribe will be in charge of turning in the Google Form in this first section, the cartographer will be mapping out routes between homes and jobs in part 2, and the bookkeeper will input data into the Google Sheet in part 3.
After discussing and weighing decisions posed in the Google Form below, the form scribe will turn in the form. The form establishes what jobs the group should be searching for in the map and accounts for some transportation costs.
https://forms.gle/TR4xG1dL5cqHGgSq7
Part 2: Scour the map for a job and a place to live
Below is a color-coded map for each group to look at together. The Google Form in part 1 will let each group know what color jobs you can choose based on your line of work. Keep in mind purple are wage jobs that any group can choose. In this part of the activity, the group should be looking at the cost of housing, salaries and wages for the jobs in the map. The cartographer is mapping out how far routes are between potential jobs and housing situations to measure the feasibility of their commute based on the mode of transportation chose in the Google Form.
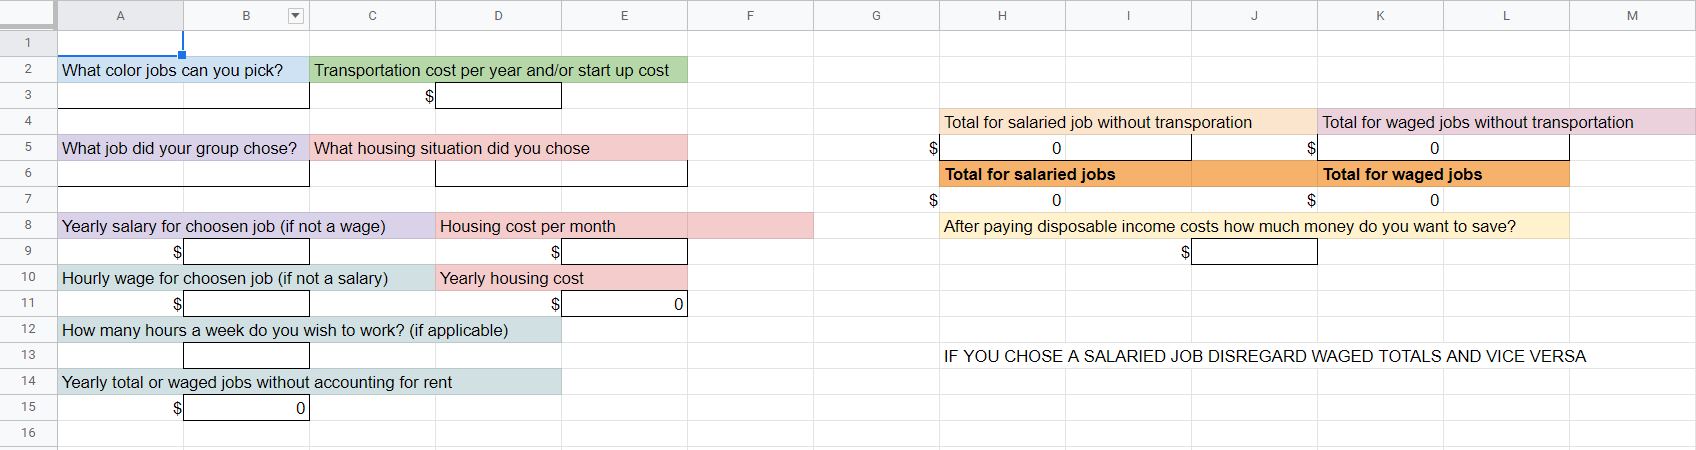
Part 3: Enter data into the Google Sheet to see how your groups option pans out
Groups will now help their bookkeeper as they enter information into the Google Sheet. There are formula’s already plugged into the sheet so things should total up as you move through the sheet. Groups will use data from this sheet in your presentation for the final step. The sheet might populate a total for wage jobs if you chose a salary job and vice versa but disregard it and only focus on the totals applicable to the job and housing your group chose.
Click on the image below to be hyperlinked to the fillable google form.
Part 4: Present your groups economic decision making in Adobe Spark
Once you have all your totals and have thought of some rationale behind the decisions your group made, make a short presentation for the class using Adobe Spark. Adobe Spark is a simple way to make an engaging multimedia presentation. Log into Adobe Spark and choose the video presentation function and make a short presentation explaining your choices with data, photos and any other media. Click on the image below to be linked to the Adobe Spark Video site. Groups will then present their choices to the class and actively listen to other groups as they too share.

Reflection:
This lesson is a fun introduction to personal finance and contextualizes some aspects of economic decision making. A large majority of my students at Oregon City High School graduate and go on to either Clackamas Community College for a year or don’t continue their education at all after HS so this activity – if run in my class next trimester – has a subtle ulterior motive of encouraging students to think about higher education. A large part of the conceptual aspects of economics revolves around decision-making and opportunity costs; this activity is a practical look into that.
Featured Image: https://upload.wikimedia.org/wikipedia/commons/c/c1/Pioneer_Sq_Portland_Oregon.jpg
Hi Justin,
I really liked this lesson – I think it is an example of an authentic assessment (which we just talked about in ED 411) because it is so realistic. It also uses such a wide variety of tools between Google Maps, Sheets, and Adobe Spark. Overall I think this would be a really engaging and applicable lesson!
Hi Justin
This looks like a great lesson, and especially useful for high school and college students who don’t really know what to expect when they leave school yet. I can remember multiple interactions where a high school classmate of mine said something to the effect of “why don’t they ever teach us anything practical we can use outside of school,” which this definitely achieves. One thing is it looks like you might need to change permissions on your Google Form.
First off – I think this is a very cool idea and I don’t mind that it has drifted from the historical thinking assignment. You have done an excellent job of capturing the essence of the intent of my assignment – by creating a space for students to do some critical thinking in economics. It’s great that you asked your students for feedback and you return with a lesson featuring “useful concepts.” A great way to show them they can be active partners in their education.
I like the MyMaps and broad selection of options – I’ll take “under the table” making gyros – it’s in my blood. Sleep in my Goose Hollow tent. Really like the addition of digital storytelling – a great way to enhance teaching economics.
Overall I think this is a great way to both teach skills and motivate students to think about make good choices. Plus it leverages a variety of tools that will add to student skill set. They will love this! And I’ll bet your CT is thrilled!
As a person who has little to no understanding of economics, I found this lesson to be extremely applicable and something that the students should be taught in school. I like the use of different applications as a way to demonstrate this activity. Overall, I found this to be extremely informative as a person who is intimated by economics and being an actual adult!