

Overview
This class will kick off a multi week exploration the largely forgotten government policies that segregated nearly every major American city and metro area. We will also look at how those unconstitutional actions have fostered inequality in America since their enactment in the 1930s. In preparation for this class students watched the video Segregated by Design.
We will also feature three student-led lessons taught by Patrick Boldt – Machu Picchu, Chris Morzenti – Moon Landing and Jacob Regge – Chicano Movement.
Class Session
Class will open with some background on the history of redline maps and will receive instruction on how to work with this week’s archival websites and there will be an introduction to our final project due on Nov 28th.
Assignment 7: Create your Redline Story | Redline Stories 21-A7
Students will use the website Mapping Inequality: Redlining in New Deal America and the 1940 US Census to explore how the “redline” maps created by agents of the federal government’s Home Owners’ Loan Corporation (HOLC) between 1935 and 1940 segregated cities all across America.

The focus should be on how the “redline” HOLC categories (best, still desirable, definitely declining and hazardous) are reflected in data from the 1940 census. And how those mortgage regulations shaped the lives of people who lived there.

Whatever approach you choose, your post should include standard elements – title, featured image, citations / links from public domain content. You may also want to use screen shots from the Mapping Inequality maps or text from the neighborhood descriptions. Or screenshots from the the 1940 census.
This is meant to be a creative exercise – so feel free to explore some options.
See Fall 2020 posts here.
You could identify neighborhoods in Mapping Inequality and find the data from the corresponding location in the 1940 census. You may want to choose a neighborhood here in Portland or some other city. It could be one you or a family member has lived in.
You could use the Census information to select a few families on that street to “tell their story” using data from the census – names, family members, housing, income, employment, country of birth. Using currency converters you could represent their home value, rent and income in current dollars.
Take a comparative approach – using information from a “Best” and “Hazardous” defined neighborhoods in the same city.
Assume the role of an actual family in the census and tell their story more narratively in the first person and illustrate with images from the era that represent the setting or examples of their type of employment.
If you had a family member who was in the census of 1940 and lived in a neighborhood identified on a HOLC – you could tell their story or what happened to your family since.
Compare neighborhood designation and some Census data 1940 to what the neighborhood is like today (Data from Zillow or Redfin. Which also sometime show interiors of home.)
How to Search the 1940 Census
Blank 1940 Census form showing categories (pdf)
Explanation of 1940 Census form (pdf)
Search the 1940 census here.
Note it works better in Chrome than Apple Safari.
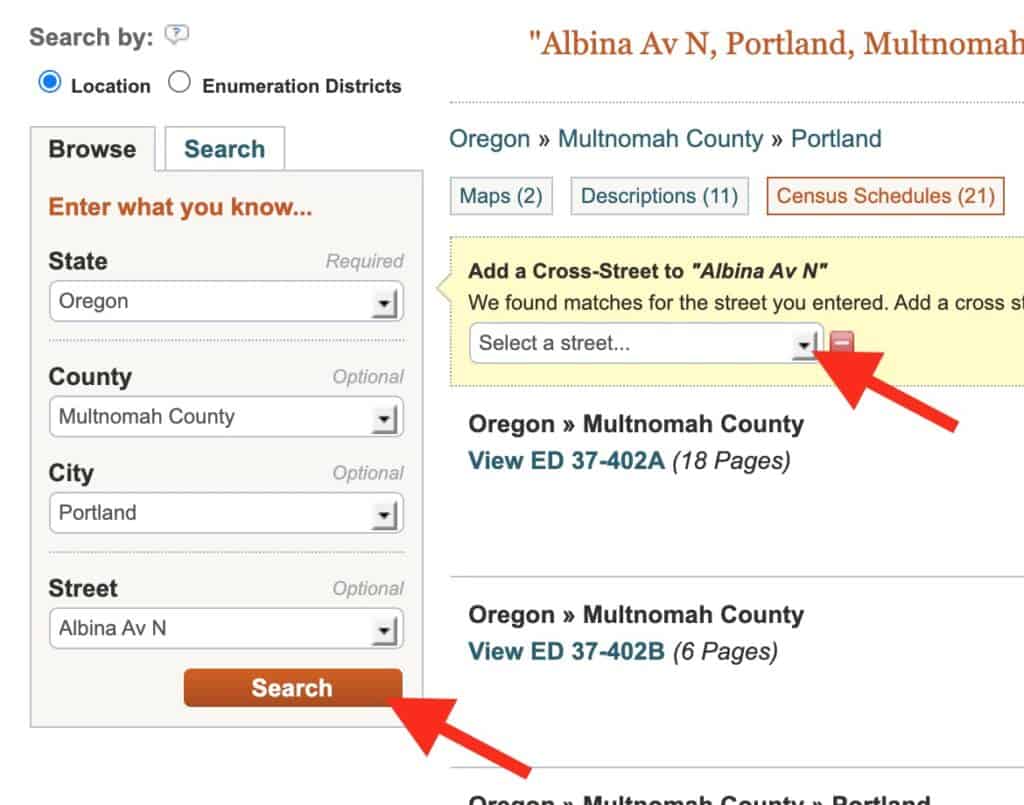
- You will “Search by location where the person lived.” Begin by narrow search by state, county, city, street.
- After you click search, you have the option to add a cross street.
3. It will take you to multipage document that may not exactly zero in on the intersection you wanted. You may need to scroll through some pages to get to that location. You can find the streets and house numbers on far left.
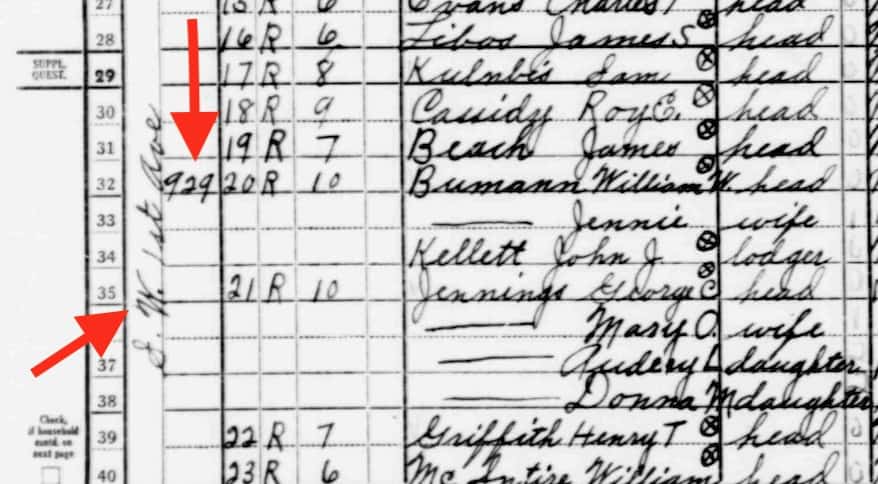
4. Then you can download the page you want.
