Data-based Lesson

I was lucky enough to be able to test a data-based learning segment on a real live class. It is an 11th grade US History class, and the students were learning about the decade of the 1920’s. The topic of that day’s class was the African American experience in the 20’s; specifically the Great Migration (its causes and effects), and the Harlem Renaissance. Vocabulary and key terms included the farmer’s depression, lynching, race riots, and the KKK.

Often student connect to history via the storytelling aspect. I wanted to strike a balance between taking a look at the meta-data of the time while not losing that sense of personalized history. An educational app called Nearpod provided the perfect platform for such a lecture.

To begin, we took a closer look at the Great Migration. This included some of the hardships faced by those making the journey, some common destinations and regions of origin, etc. When discussing “push factors,” I had students click on the link within the Nearpod app, which each student was using on their own Chromebook, to this website. The website they arrived at contains an interactive map that shows every lynching to have been recorded throughout US history. Students can change the date range, zoom in on specific states, view clusters of attacks categorized as race riots, and discern the race of the victims using a color-coded key.

http://www.monroeworktoday.org/explore/m/map2/#3.99/37.34/-93.6

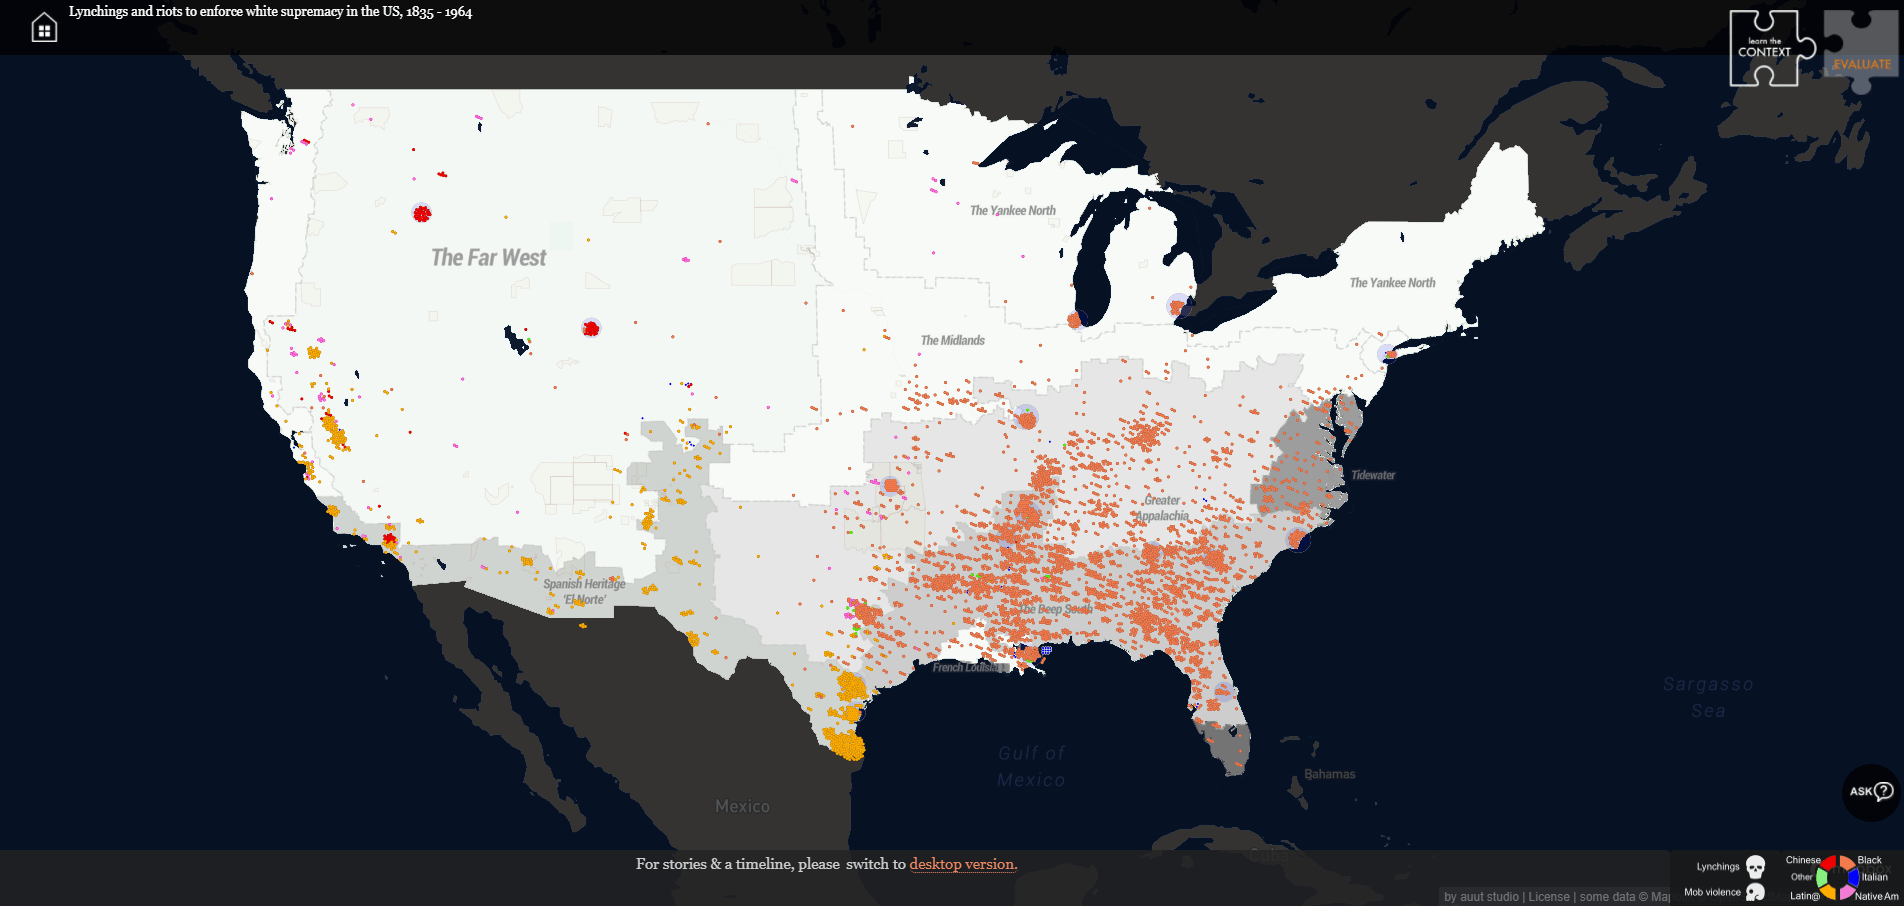
Students were prompted on how to navigate the site, how to adjust the date range, and what to look for. They were asked questions about what kinds of patterns they observed, etc. It was a stellar opportunity to incorporate higher level thinking questions.

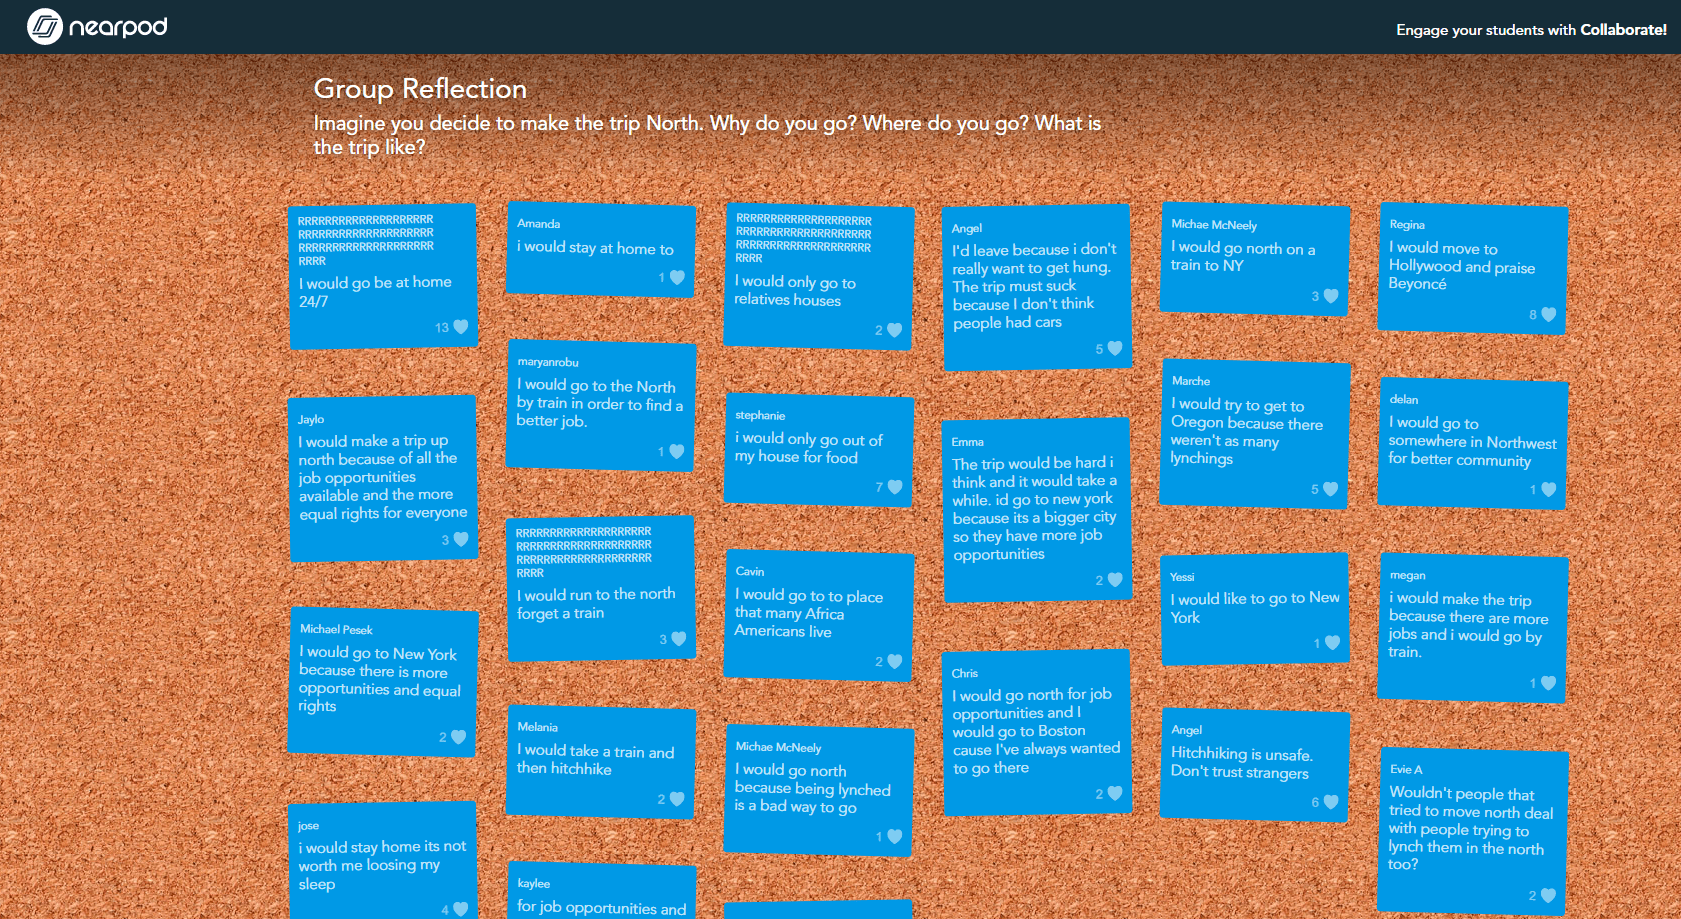
Next, they were asked to discuss collaborate whether,given the circumstances, they would have moved if they were alive at that time. The posts appeared to the class on the projector screen as a bulletin board with their messages posted onto it like notes.

Lastly, students were shown a map of the South prior to 1920, with regions that had a high population of African Americans shaded in darker. They were asked to draw the migration route that they would take if they were plotting their escape. Here are some samples of their work:

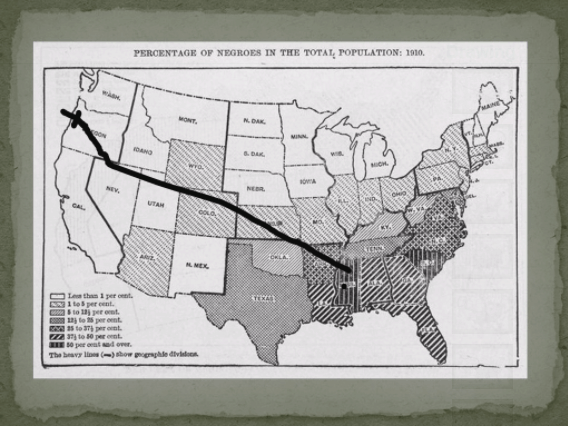
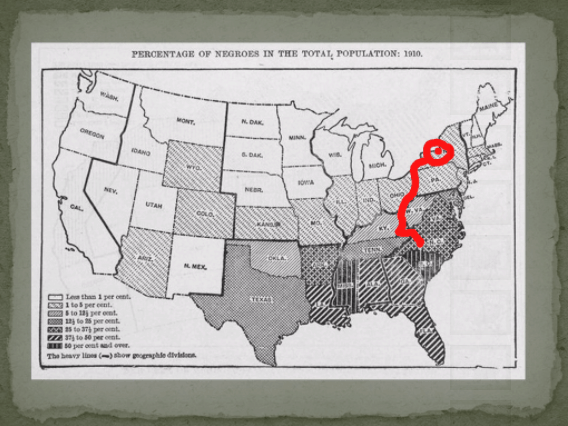
This led to a discussion about whether African Americans would have been welcome in Oregon, why they settled in urban centers, and more. Overall, I think the data made a big impression on the students and played a significant role in shaping the lesson as a whole. I look forward to using more meta-data in the future.

A Survivor’s Journey Storymap

Link to Oregon Holocaust Memorial site

Direct link to StoryMap

In order to learn how to implement project-based learning into our instruction, we have been engaged in some project-based learning of our own. The memorial project has been incredibly motivational. It has compelled me with a powerful intrinsic drive that I am eager to pass onto my own students. For my part, I chose to work on generating a timeline based on the story of a survivor that calls Portland home. As someone that was raised Jewish I felt that I might have more of an understanding of some of the cultural references, and so sifting through stories could be a natural strength of mine as a contribution.

Before I could begin to work on a timeline I first had to select a story to portray. With dozens of survivor stories to choose from, I read as many as I could stand. It was an emotionally draining task, but also an important part of the learning process. Having an educational goal that required me to do this type of research made learning feel like discovery. In order to create a storymap that would be visually appealing and compelling, my main criteria were that the survivor had to have moved around a lot and had to be directly involved. I didn’t want to base the project off of an interview with someone describing what it was like for their family if they didn’t experience it directly, and I wasn’t looking for the story of someone who had bee-lined straight from Europe to Portland either. When I stumbled onto Manny’s story I knew that I had struck gold.

After reading through his account more than once, I picked out what I thought to be the most pertinent details as well as a list of everywhere he had lived on his exodus across the world. I used a free tool for creating interactive timelines on the website knightlab to bring all the pieces together.

I downloaded pictures from websites like Wikicommons and Flickr. These sites have photos that are within the public domain and have usage rights that permit them being re-published. Even though they are public domain, I made sure to cite them if the author requested it. I picked points on a world map that approximated stops on Manny’s journey, and in each location I added an image and blurb containing excerpts and paraphrased info from his interview. After editing the final product, the project was ready to be added to the website. If I had more time I would have liked to add two or three more. Maybe this could be a project for one of the classes that comes to visit the memorial.

Assignment 6: Teaching Historical Thinking Skills of Contextualization and Sourcing

An Account of The Red Summer
Adapted from a lesson by SHEG

Directions:
Use this letter and your knowledge of history to answer the questions that follow.

Background information: The events described in the following letter take part during a time referred to as the “Red Summer,” referring to the summer of 1919. It was a time when there was a sharp increase in race riots across the country, in the North as well as the South. This document comes from the archived records of the NAACP, the National Association for the Advancement of Colored People.

Source text:

Monday July 21st, 1919
I was returning to Washington after having been out of town… I arrived at the Union Station at 12 pm, [and] boarded a street car… When I reached… the place of transfer I noticed that things were as quiet as it usually is at that hour of the night. I waited there about 5 minutes for the Brightwood car and when it came I and a Captain boarded it. I walked into the car and soon noticed that I was the only member of my race present except a lady whom I noticed later but not at this time. As I started to get a vacant seat a soldier put his arm across me and said “where are you going n—–?” I said to him that I was going to get a seat, As [sic] I was telling him that I heard some others in the car saying “lynch him”, “kill him”, “Throw him out of the car window” and at that time I was being grabbed from all sides. I forced my way to the rear door and was hit by something as I stepped off, which cut my ear and bruised my head. As the car moved away the conductor fired three shots at me. It was as I got off the car that I noticed the lady on the car, what became of her I do not know.
James E. Scott

Image and interview source: Library of Congress NAACP: A Century in the Fight for Freedom. Williams Jacobs

Other facts related to Mr. Scott’s letter:

1. The so-called “Red Summer” riots took place across 25 cities. This included riots in Illinois, Nebraska, Washington D.C., and Texas.
2. Mr. Scott’s account describes the 5-day Washington Riot, which started on July 19th, 1919. The riots began when reporters published sensationalized (hyped-up) headlines describing attacks on White women by Black men.
3. In response to the headlines, White servicemen began assaulting Black pedestrians
4. This letter was Mr. Scott’s affidavit. This means it was a legal court document signed under oath that testifies to what Mr. Scott witnessed.

Question: Which 2 of the 4 facts above help you figure out whether Mr. Scott’s experience of being involved in a race riot was typical (usual) or atypical (unusual) of Black men in the 1920s?

Explain your reasoning.

Fact # ___ helps to show that Mr. Scott’s experience was either usualor unusual because:

Fact # ___ helps to show that Mr. Scott’s experience was either usual or unusual because:

Question: Which 2 of the 4 facts above help you decide if Mr. Scott is a trustworthy source?

Fact # ___ shows _____________________ because:

Fact # ___ shows _____________________ because:

My Very First Screencast

This 35 second video is the culmination of nearly two hours of work. I would consider the time consuming nature of video editing to be a drawback, however I am still ascending the steepest part of the learning curve and it would likely become easier with experience.

This project was meant to mimic the style of the opening page on University of Portland’s website. As soon as the page loads there is a video of students rock climbing at the rec center.

Using Cantasia, I was able to create a video slideshow using images of the memorial. One of them was from Wikicommons, and I edited the attribution onto the photo using Adobe Spark. The others were “borrowed” from Peter (I hope he doesn’t mind).

What if we had something like this on a loop set as part of the landing page for our website, so that when people first arrive at our site they are immediately greeted with moving images? As the weather changes, it might be nice to go up there and get a 10 second video clip of leaves falling around the memorial, or snow falling, to add dynamism to the effect.