Portfolio Highlights

Featured Image from Pixabay

My favorite thing about this class was that the work we did felt meaningful. I do not necessarily hate doing busy work, but I would rather be challenged to create something that I will be proud of. With that said, it means a lot that I now have a portfolio that shows off my skills. Here are a few highlights from the semester of assignments I felt strongly about my performance on: 

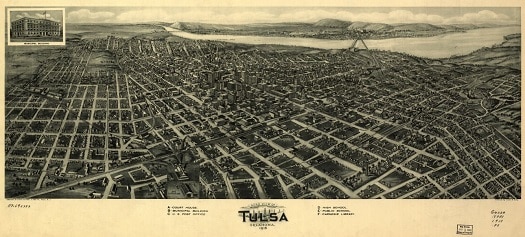
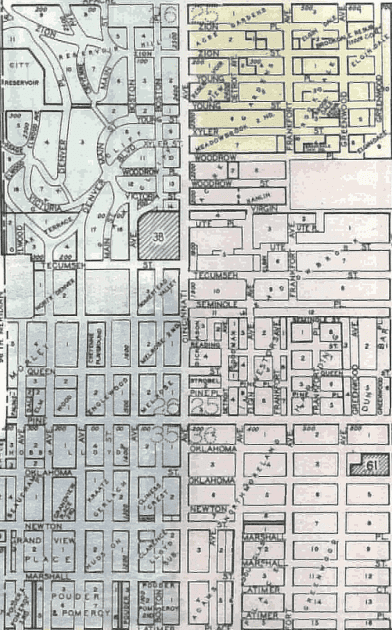
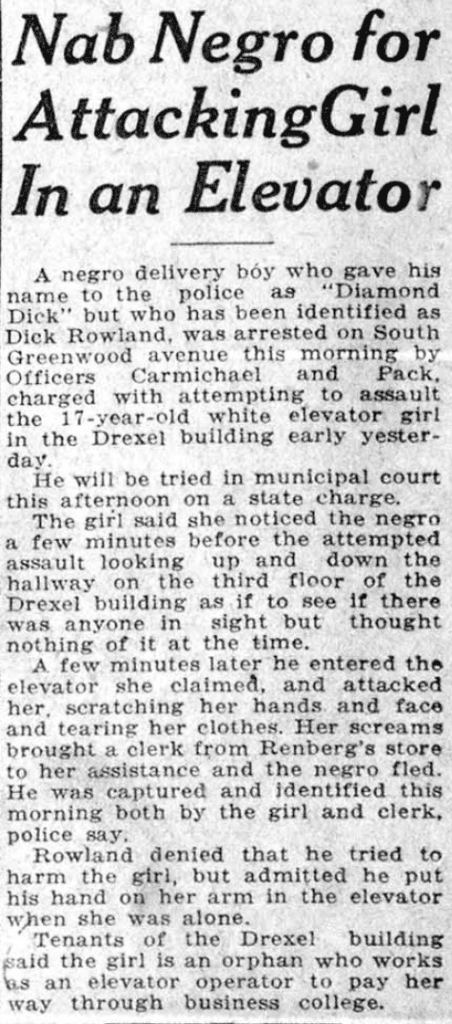
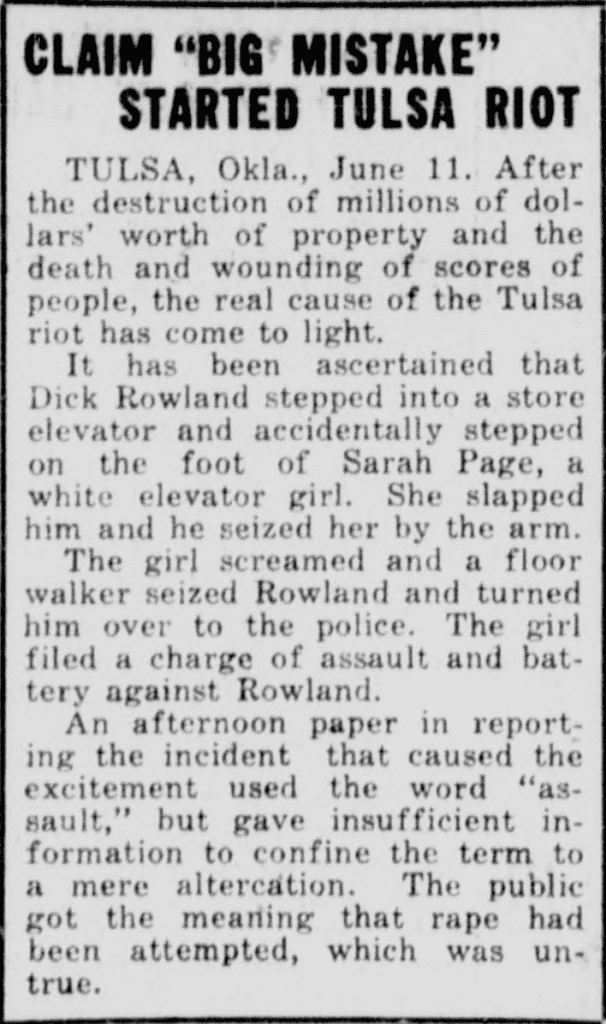
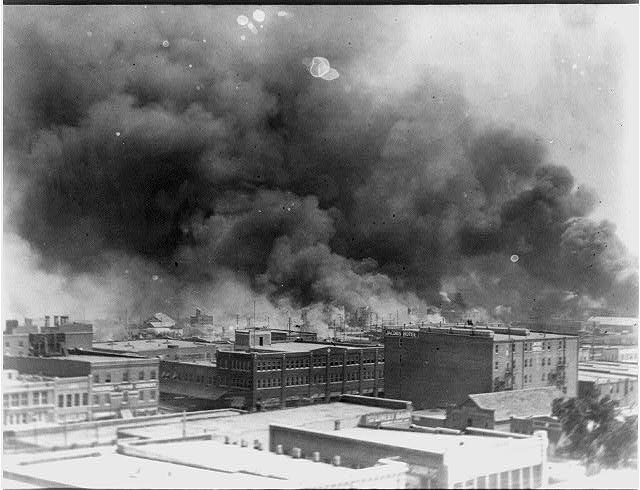
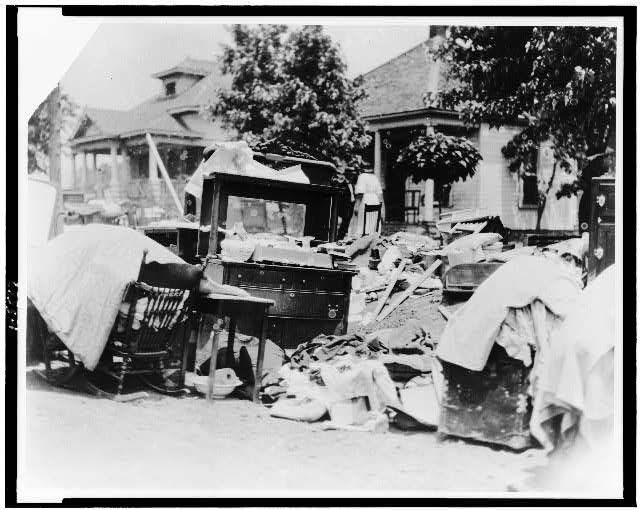
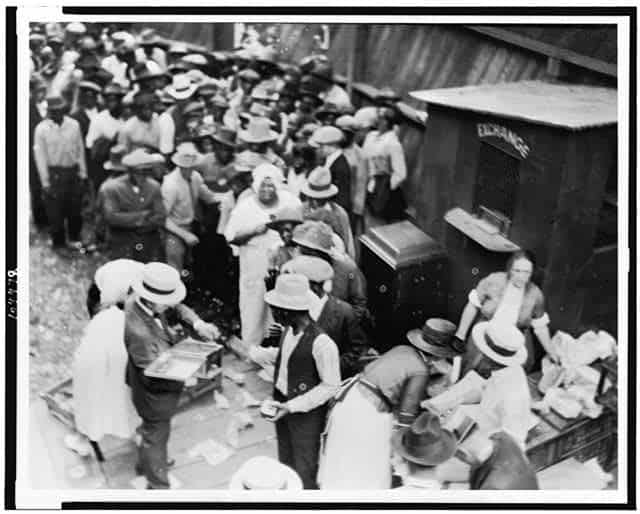
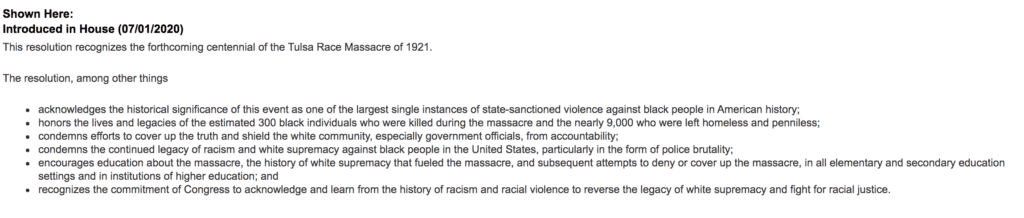
My final project, “Massacre or Riot? Tulsa Race Massacre” is a good place to start. I focused my final project on the Tulsa Race Massacre. I thought it was just something that was appropriate given the general social climate in modern day. It was also something that has been “brushed under the rug” in American History. In its own way, the fact that it was brushed under the rug, almost makes it more representative of American History than many other events we learn about in school. I tried to draw a focus to the fact that history is written and recorded by those in power. It took nearly 100 years for the U.S. Congress to recognize this atrocity as a massacre, rather than a small civil disagreement/riot. The sad truth of history is that those who survive generally decide what is going to be shared to future generations. The mix of several newspapers, images, guided questions, and a redline map made it possible for me to both convey a narrative of why this massacre may have happened, as well as leading students to their own conclusion about why this massacre is being recognized nearly 100 years later. 

The next project I was really proud of was my “Investigating the Rise in Cost of Oakland Homes” project. This was, in theory, meant to be an investigation of my mother’s childhood home. I ended up discovering that Oakland’s census data from 1940 was incredibly inaccurate and oftentimes not even complete. I discovered this by mulling through census data for hours, only to find that the data would stop right in the middle of streets, or that houses would just be missing entirely. There were also several discrepancies in data pertaining to the job/income of the homeowners listed which made it nearly impossible to estimate how much homes were worth. This was because the census had figures listed where these homeowners were living in 1.7 million dollar homes making the modern day equivalent of $27,908. It just didn’t make sense. I ended up using several online tools to find average incomes of certain professions, as well as using this average yearly income to estimate the appropriate home cost for someone in that income bracket to estimate the value of the homes I ended up comparing. I also ended up using a redlining map to compare household costs in a “green” neighborhood versus a “red” neighborhood. The green area was more representative of the area my mom grew up from ages 8-12, while the red was more representative of the house she was born in. In both cases, these houses were left out of the census data. Once I figured out the costs of the homes I compared, I then extrapolated that the costs of these areas are affected by crime rate, noise, and other factors that are available for viewing on real estate sites such as RedFin and Zillow. I was proud of this project because I felt like a detective creating it. I really had to dig deep to compare the houses in these different neighborhoods. It wasn’t as simple as viewing census data, and checking the boxes. I really had to use the resources available online to effectively compare the different neighborhoods. It was a lot of fun, and it is a good example of how resourceful I can be when it becomes necessary. 

The “Reaction to Moon Landing: American vs. Russia” project was another one that I really enjoyed. It was an interesting challenge to teach an entire lesson with absolutely no lecturing (from videos or myself). With the exception of a short article used for background information, I used nothing except images and contemporary newspaper articles to teach “students” about the Russian reaction to Sputnik/Moon Landing versus the United States’. It was really interesting how much discussion these images invoked. With enough time, the students were able to completely teach themselves what the differences between the two countries’ reactions were. They knew it nearly as well as I did, and I read articles, watched videos, and listened to lectures about it. It was interesting how effective looking at images and reading contemporary newspapers can be for learning. It was fun to create, it was fun to teach, and the students enjoyed it. It was an all-around success. 

Finally, “The ‘High Point’ for Vaccines” assignment was the last interesting assignment I am going to share today. Inspired by our current pandemic, I wanted to compare the vaccine response between the Polio Epidemic and the COVID-19 Pandemic. As a child, I always heard about how excited everyone was to get the Polio vaccine, and that they would give students the vaccines directly at school. After seeing the public response to the COVID-19 vaccines, I had to know whether or not Polio was handled in a similar way. I ended up discovering that Polio had nearly a 90% approval rating in the United States. This number has only decreased due to a number of factors such as social media, news outlets, etc. I wanted to show images of the Polio epidemic that elicited both an emotional response but also encouraged thought. I wanted these images to encourage students to draw connections between figures such as “Beewell” and other forms of propaganda used today. My guided questions also focused on how the fear of needles and a phobia of vaccines could potentially be linked. It also begs the question of when/why vaccines began to be administered through needles rather than through another means. This assignment was just a unique reflection on issues that affect us on a daily basis, and it allowed me a really good opportunity to ask interesting questions about how our society has learned to handle epidemic/pandemic threats over the last 70-80 years. 

In the end, this portfolio will be an invaluable tool for crafting my future. I enjoyed putting it together, and I am happy that I came out of a class with a good amount to show for it.

Massacre or Riot? Tulsa Race Massacre

Featured Image from Library of Congress

The Greenwood District of Tulsa, Oklahoma, also known as “Black Wall Street”, was once a shining example of African-American success within the United States. Throughout this district, African-American businesses, homeowners, and settlers thrived. It was a place of cultural and ethnic representation that was unique to its small pocket of Tulsa. 

On May 31, 1921 all of that changed as houses, business, and streets were set aflame by masses of white-surpremacists. In what has now become known as one of the worst acts of racial terrorism since the age of slavery, the Greenwood District would cease to exist, at least in the way people once knew it. Over 300 individuals were killed, 6,000 or more left homeless and without a means of income, and millions of dollars of property damage was the scar left on “Black Wall Street.” Unfortunately, this event has been forgotten by history – likely in an attempt to cover up an embarrassing scar of US History. 

Assignment: Using this background information, along with the documents (photos, redline map, and newspapers) provided, piece together the events of the Tulsa Race Massacre and how they occurred. Investigate what events transpired to cause the riots. Once you have investigated these causes, attempt to answer the essential questions provided.

Essential Question: In what way(s) is the Tulsa Race Massacre representative of US History? 

Bonus Question: Why was this event recognized by Congress in 2020, nearly 100 years after the massacre?

Screenshot from Mapping Inequality
The red district is Greenwood

Question for Map: What do you notice about the Greenwood district? What surrounds it? Is it reasonable to assume why this neighborhood would have been attacked based on its redlining desirability rating?

Photo from Library of Congress

Question for Article: In what way was this story misconstrued to fit a certain narrative?

Photo from Library of Congress

Question for Article: How does the article about the massacre differ from the last newspaper? Was the massacre downplayed?

Photo from Library of Congress

Question for Photo: What was the point of burning business rather than just attacking people in Greenwood?

Photo from Library of Congress

Question for Photo: Why was this furniture found in the streets? Who did it belong to?

Photo from Library of Congress

Question for Photo: What was the predominant demographic of the food distribution following the massacre? What does this tell you about the population of Greenwood?

Screenshot taken from Congress.gov

Transcript of Congressional Resolution:
“This resolution recognizes the forthcoming centennial of the Tulsa Race Massacre of 1921.

The resolution, among other things

  • acknowledges the historical significance of this event as one of the largest single instances of state-sanctioned violence against black people in American history;
  • honors the lives and legacies of the estimated 300 black individuals who were killed during the massacre and the nearly 9,000 who were left homeless and penniless;
  • condemns efforts to cover up the truth and shield the white community, especially government officials, from accountability;
  • condemns the continued legacy of racism and white supremacy against black people in the United States, particularly in the form of police brutality;
  • encourages education about the massacre, the history of white supremacy that fueled the massacre, and subsequent attempts to deny or cover up the massacre, in all elementary and secondary education settings and in institutions of higher education; and
  • recognizes the commitment of Congress to acknowledge and learn from the history of racism and racial violence to reverse the legacy of white supremacy and fight for racial justice.”


Question for Resolution: Has our perception of the event changed? If so, what has caused these changes?

Sample Answers for Questions:

  1. The Greenwood district is in a red district that is entirely surrounded by green and blue districts. It makes sense that this would have been a red district back then, as it was mostly where POC lived, and it also makes sense why they would have attacked it. If it was surrounded by blue and green, getting rid of the demographic that is bringing down the rest of the area seems like an effective means of increasing the property value of the areas around it, provided the history of the massacre was covered up.
  2. The girl was clearly playing the victim card in order to make the delivery boy seem like a hostile attacker. He was clearly just doing his job and accidentally bumped into the girl. Whether it was to get her college paid for or to start something with the African-American community, there were clearly ulterior motives for her story that wouldn’t have existed otherwise.
  3. The story about the delivery boy was talked about as if it were an accident, which is only noteworthy because prior to the riots, they had published the newspaper article calling him a “Negro” and accusing him of attacking the girl. The massacre was heavily downplayed in the article because they just call it a riot, instead of a race driven attack.
  4. Destroying the buildings creates generational struggles, while attacking people creates individual struggles. If you destroy the livelihood of one generation, the next generation will struggle even more significantly to get back on their feet. All of the wealth they had accumulated would be gone, and the motivation of those affected would change from striving for success to striving for survival.
  5. The furniture was found in the street. It is likely whatever survived from peoples’ homes when they went up in flames during the riots. Therefore, the furniture belonged to the residents of the Greenwood district.
  6. The predominant demographic was African-American because their homes, business, and livelihoods were destroyed as a result of the race riot. Most of these people had no money, and no means of making money, forcing them to use the food distribution lines.
  7. Our perception of the event has changed significantly over time. There was a period of time where the attack was considered a tragedy, but likely no one was at fault. Nowadays, it is clear who was at fault, and it clearly had nothing to do with the thriving African-Americans of the Greenwood district. Even if the delivery boy did assault the girl, that was no excuse to burn down an entire district of POC. It was a clear disregard for human lives where many people died, and many more were left to suffer. It was a tragedy, but not one that is without blame. The reason our perception has changed so much is because we are starting to not shy away from learning the ugly parts of our nations’ history. Instead of acting like they didn’t happen, we are choosing to learn from these events rather than acting like they didn’t happen. Legislation and national recognition are following the fact that more and more people are learning about these events. We need to continue to learn about our history, otherwise people will continue to be affected the way the residents of the Greenwood district were, and nobody will be held accountable. We learn about these things so we know how to react to them when they inevitably happen again. 

Investigating the Rise in Cost of Oakland Homes

Featured Image taken from Griffin Woolridge at Pexels

Backstory: 

My mom was born in Oakland in the early 1960’s. Her first home was out near Lake Merritt before her parents decided to move up closer to the Mormon Temple when she was 8. My mom’s parents bought a house on Burdeck Drive, where she would live until she was 12 years old. Their house was beautiful, and was surrounded by massive homes in a very high income area, even during her childhood. When people think of Oakland, their first instinct might be to think about the crime rate, the reality is that Oakland is a beautiful city on the bay. It just so happens to also have a relatively high crime rate. With that said, Oakland, similar to other cities in the Bay Area, has gone through its own share of gentrification, and houses all over the city have skyrocketed in price, even in areas that have historically been known for their high crime rates. Even houses in generally unfavorable areas are worth upwards of $750,000, or even more in some cases. 

Unfortunately, the 1940 US census data for Oakland is unfinished at best, and inaccurate at worst. There are streets named incorrectly, houses missing from lists that were verifiably existent during that time, and many other issues. With that said, my mom’s house unfortunately cannot be found on Burdeck Drive (named Burbeck Drive) on the Census. However, there is a house just down the street which can give us an idea of how much Oakland prices have skyrocketed in different areas. 

By looking at a Redlining map of 1935-1940’s Oakland, we can get an idea which parts of Oakland have generally been considered favorable to live in, versus unfavorable. For the purposes of comparing two locations, I chose a house down the street from my mom’s home on Burdeck 3216 Burdeck Drive (Section A), and compared it to 1088 88th Avenue (Section D18). 

I did some digging on Zillow, as well as other realty sites in hopes of finding some additional information about different homes in Oakland. I wanted to find out why certain houses appreciated more than others, and by how much. I also wanted to compare the incomes of the two locations during the 1935-1940s era, just to give an idea of what types of people would have been living in each of these locations. 

Comparing the Houses: 

To start with a modern day price, 3216 Burdeck Drive has a Zillow Zestimate of $1,701,100. The house is 3 Bed, 2 Bath and 2,538 Sq. Feet. It is also located in the Oakland Hills, where historically speaking, family incomes have been considerably higher. According to the map, while there is no data on section A, Section A8 had an estimated family income of $6,000-10,000 per year in 1940 which would be worth $111,632- 186,053 in 2021. 

Photo taken from Redfin

Comparing this to 1088 88th Avenue, the house is 3 Bed, 1 Bath and 1,464 Sq. Feet. The house has a Zillow Zestimate of $484,900. The house is considered to be in a Redlined area, which in the case of D18, was known for lower family incomes and higher ethnic minority populations, at least during this time. According to the map, the family incomes in this area averaged $1,200-3200 per year. This would be roughly equivalent to $22,326 – 59,537 in 2021. 

Photo taken from Zillow

By using Realtor.com, you can overlay maps of cities to compare crime, noise, and flood risk. For crime, 1088 88th Avenue is considered to be in an incredibly high crime ridden area, according to these maps. For noise, it is considered to be in a medium noise area. Finally, for flooding, it is at effectively no risk. To compare this to 3216 Burdeck Drive, where the house sits in a low crime zone. In terms of noise, the house is in a medium-low area, and there is also virtually no risk of flooding. 

Comparing Incomes: 

There is no question about it, the price of 1088 88th Avenue is being affected by factors such as crime and noise. However, this makes you wonder how much. In order to figure this out, I looked back at the 1940 US Census Data to find the specific income of the families who lived in these houses during this time. That way, I can estimate the cost of these houses based on what someone with their income would likely be able to afford. 

The income of the family living in 1088 88th Avenue was $900 which is roughly equivalent to $16,745 when accounting for inflation. In 2021, someone with that income could not afford any houses in Oakland. However, the census does state that the individual was a carpenter. By looking up the average wage for a carpenter in 2021, we can better estimate what type of house someone would be able to afford with that occupation. The average carpenter salary is $57,958. With this inference, we can see that carpenters seem to make more money in 2021 than they would have in 1940. With that said, someone with an income of $57,958 in 2021 would be able to afford a house that is worth $241,364.56 according to the HSH “How Much House Can You Afford” calculator. This would suggest that this house has roughly doubled in value since 1940 according to these calculations. The problem with that is the dollar is worth roughly 1/18th what it was worth in 1940, meaning that this house has severely dropped in value since 1940 when accounting for inflation. 

When comparing this to the family of 3216 Burdeck Drive, it is a bit more complicated. The owners of the house were a retired Dressmaker and retired Musician. However, their house was estimated to be worth $1,500 according to the 1940 Census Data. This would be worth $27,908 in 2021, meaning that this house effectively multiplied its value by 60.95 times from 1940 to 2021. This is assuming that this is referring to the total value of the home if it were owned,  and not the monthly rental value, as $1,500 per month for a rental home back then would have been impossible for most families to afford. While neither of these figures makes complete sense, it seems much more plausible that a house’s value would multiply by 60 times than for someone to be forced to pay the equivalent of nearly $28,000 for rent. This was the figure that was provided, so it is the figure that will be used. It would be difficult to argue any other way, as dressmaking and being a musician both count as private practices, and their incomes are not listed, so it is nearly impossible to estimate the value of the home without the $1500 figure. It is, however, entirely possible that the census is incorrect about the price. Maybe they meant $15,000 which would put the price of the home closer to $279,079 in 2021. This would put the houses’ increase in value at about 6.1 times its original value which is still a pretty significant increase in value. 

To summarize, select parts of Oakland have gone through immense gentrification, with an influx of wealth making its way into the Bay Area. Ultimately, while the prices of houses have gone up throughout the city, only certain areas have seen the prices of houses match or even exceed the rate at which inflation is occurring. In the case of 3216 Burdeck Drive, the growth was seemingly astronomical, although almost unbelievably so. For 1088 88th Avenue, the growth was much more modest. This was likely due to the factors such as crime and noise, as well as just how preferable each given area was to live when considering a Redline map.  

Reaction to Moon Landing: America vs. Russia

Target Audience:
The target audience for this would be a high school or college US History class, particularly one that covered the 1900s. Ideally, if this was a high school course, it would be used on APUSH students, as they may have a more solid understanding of Cold War politics.

Content:
In general, the target audience would need to acquire some kind of understanding of Cold War politics, as well as the general rivalry that the United States and Russia have had since. In this case, there will be a short article provided as a means to brush up on the main points. This particular lesson would work well right after discussing both the moon landing and Sputnik. This would allow the students to see a bit of the rivalry between the US and Russia play out in the form of the “Space Race.” The “Space Race”, of course, being a period in time where these two led the charge worldwide to see who could do everything from launching satellites, putting living creatures in space, putting humans in space, and finally – putting a man on the moon. This was no small feat, and understanding how many failed attempts went into each of these missions would only create a better experience for the students completing this activity. Likewise, allowing the students to learn about Sputnik and Apollo 11 would hopefully emphasize how much of a “victory” each of these countries received from beating the other to these given milestones.

The point of this activity to is allow students to view each country’s reaction to these milestones so they can create the connections that the “victory” that was felt on each end was more than just a scientific milestone being reached. In particular, the students will be able to make the connection between the significance of becoming the victor of the space race, and the symbolic victor between the Western and Non-western world.

Process:
1) Students will read this article at the beginning of the class (Should take 5 minutes or so)

2) Students will be assigned to groups

3) Students will be given a series of guiding questions (provided on the Jamboard), and will be sent to look at a series of photos from the post-Sputnik period and the post-Moon landing position.

4) Students will open the Jamboard provided, as well as view this image provided by Getty Images and Bettmann.

5) Students will spend 10 minutes observing the photos and answering the questions.

6) Students will be called back, and asked for their interpretation/ to share any interesting observations about the photos.

7) Students will then debriefed by the teacher answering the question of what was different about each country’s reaction, and why this may have been.

Russian Newspaper photo from Getty Images and Bettmann
Featured Image taken from Pixabay