As we wrap up our term, it is time to reflect on the learning that has taken place in Methods. I can honestly say I was apprehensive about taking on this journey: the outlier older student who was not teaching history rather, economics, for student-teaching. In addition, with very little interest in, or experience with, social media, I wasn’t quite sure how I felt about posting to a blog. It has been interesting and engaging, however. I have truly enjoyed learning from Peter and from my peers. I have enjoyed the process of creating, enjoyed viewing my superstar-peers’ work, and have found myself very interested in the variety of tools and platforms we’ve been asked to play with. From learning WordPress to Google Forms, from exploring data visualization tools, to spending more time developing historical thinking skills, I am walking away with so much practical knowledge and a new set of skills with which to create and facilitate captivating activities for students. As I continue this journey and have my own classroom, these are skills that will inspire me to emphasize primary source materials in innovative ways. My students will have digital based access to content, encouraging comprehension through deeper analysis: sourcing, contextualization, corroboration, and close reading. Guided by the foundation lesson posts that follow, I will continue to practice the work that has just begun.
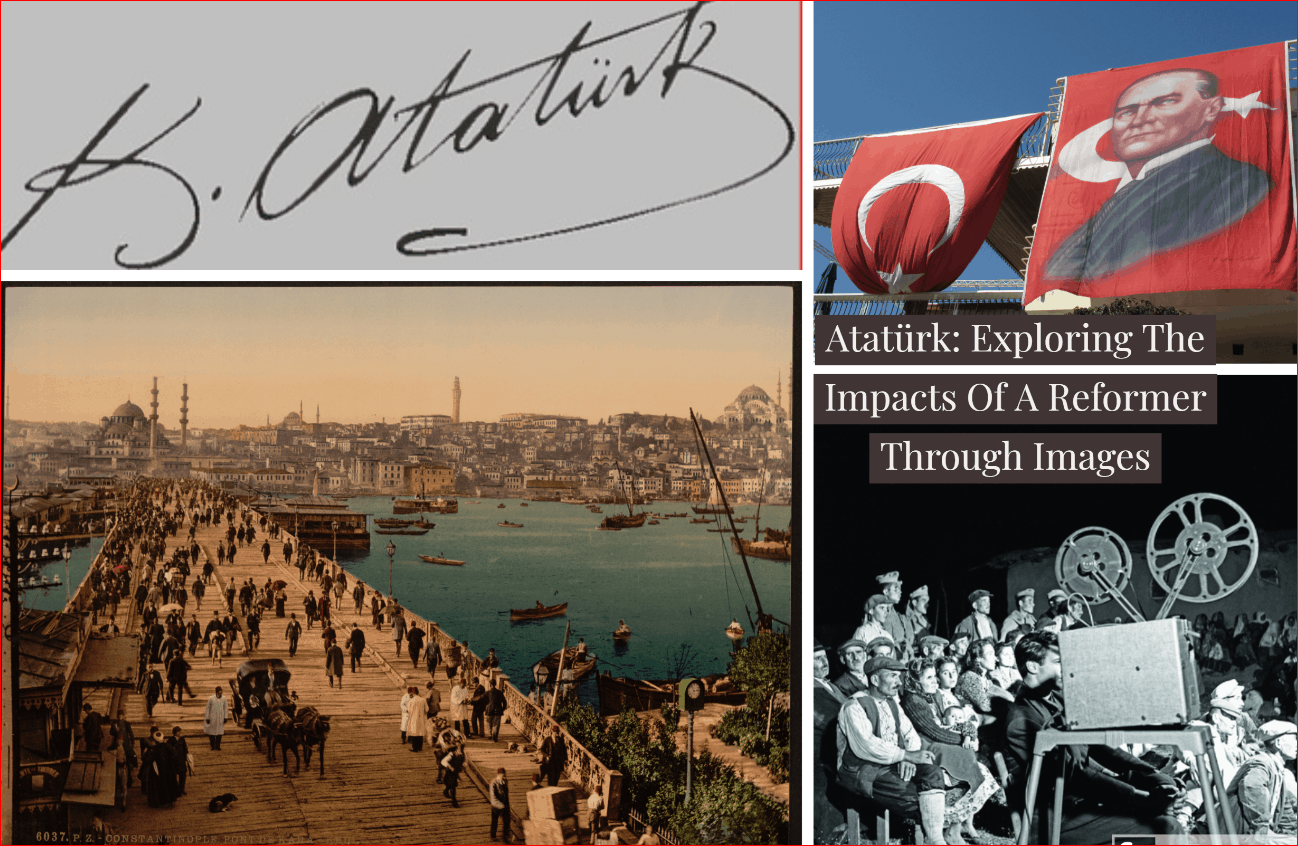
Essential Question: Why is Mustafa Kemal Atatürk considered the father of Modern Turkey?
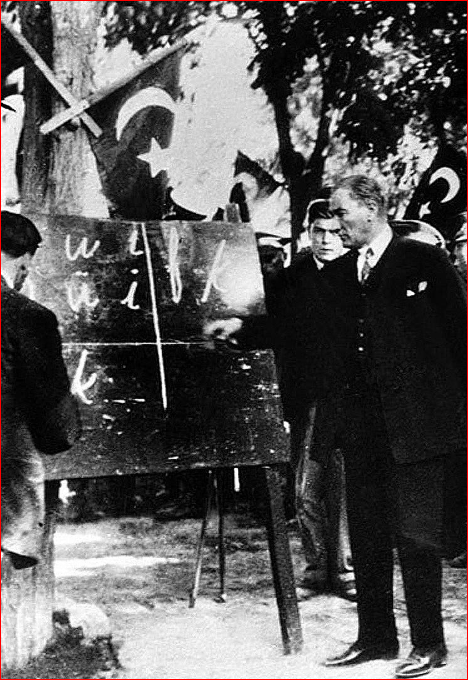
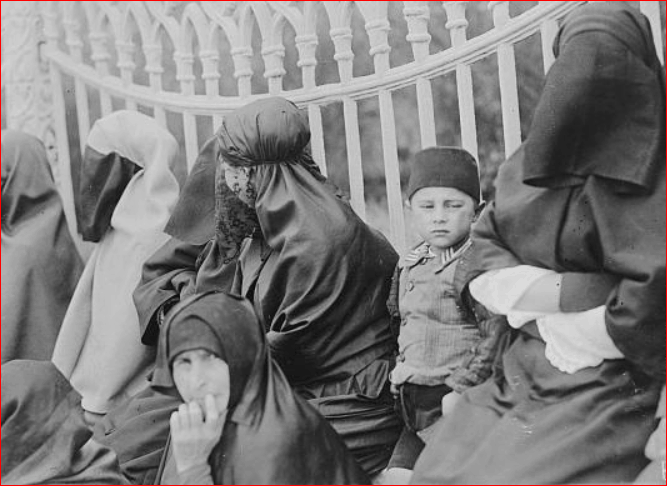
Historical Context: Atatürk led the fight, both externally and internally, to salvage the remains of post World War I Ottoman landscape to create The Republic of Turkey. In 1923, he became the first President and, committed to his Nationalist vision, secularized and modernized Turkey through a series of reforms based on European models. In 1925, for example, all men were required to forgo the iconic fez hat and wear European style hats. A Swiss based civil code went into effect in 1926 resulting in many liberating societal aspects for women including in equal inheritance, access to education, and in dress. A more gradual shift led to full voting rights in 1934, well before many of their European counterparts. While access to education for women was celebrated, education in general was no longer the extension of religion. Arabic script was replaced with Latin for written Turkish in 1928 and Islam was no longer to be the State religion. Reforms went on into the 1930’s.
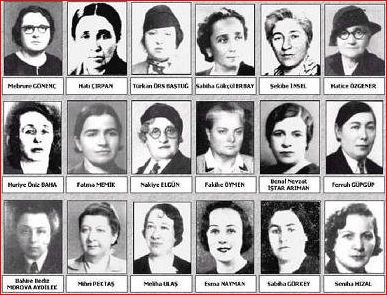
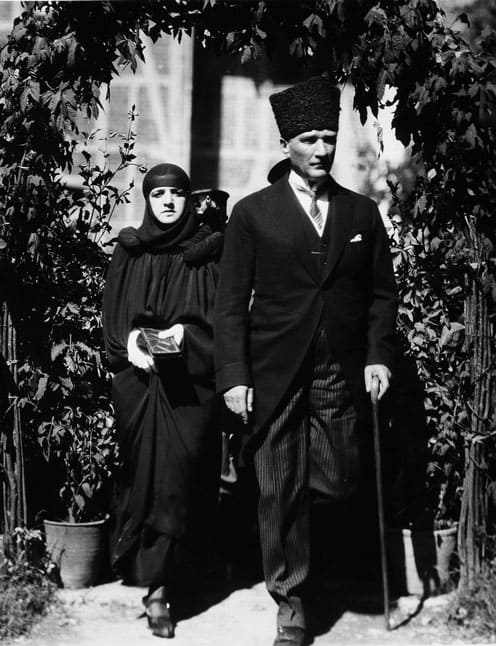
Activity: students will analyze pre- Atatürk reform images in relation to images taken during and after reforms were implemented. The latter images of the ‘sets’ represent the outgrowth of just a handful of the myriad reforms instituted by Atatürk, whose legacy carries on today.
Students will look at the photo, look for patterns, and identify
key defining aspects of the photo: people, dress, activities, objects, etc. Students
will record their independent observations and then share with a neighbor on
what impressed them.
Next, students will consider what the photograph says about the era vis-à-vis culture, societies expectations of women, the economy. What does the photograph suggest? Why do you think that? What elements are suggesting this? Students will record their independent observations and then share with a neighbor.
How does each image reflect each time period? What might you infer about the different eras that is suggested by the differences in the images? What do the differences suggest about changes in societal norms, education, culture (such as women’s dress and/or role in society)? Students will look at the images in relation to one-another. Students will record their independent observations and then share with a neighbor.
Information will be presented on Atatürk’s reforms. Image observation invites student reflection on their evaluations of the era differences based on a specific reform.
Students will choose one set of images and submit a written reflection of the effects of Atatürk’s reforms with specific evidence from the photos to justify their evaluation.
Time permitting, students will view a video of Atatürk giving a speech in 1933 marking the 10th anniversary of the Republic of Turkey. It is in Turkish but has English subtitles. source
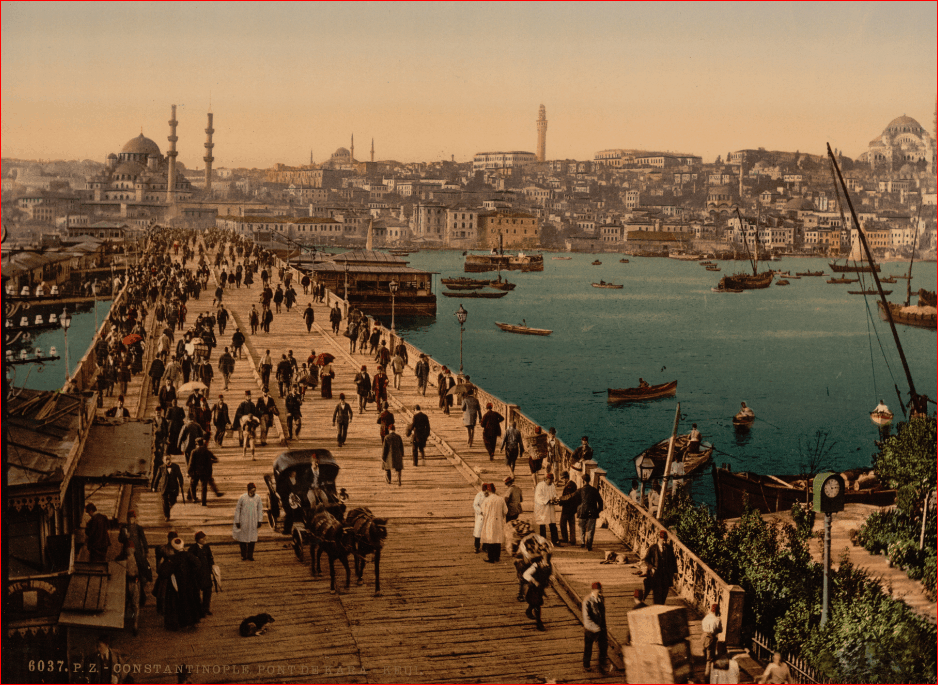
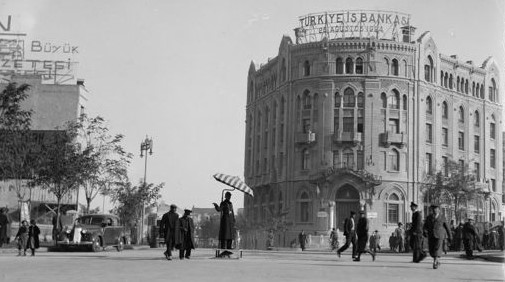
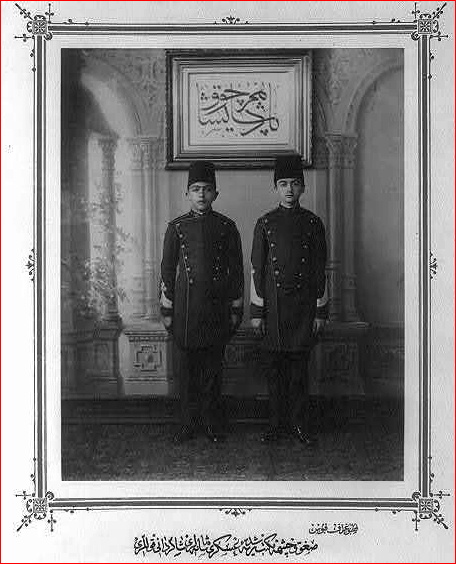
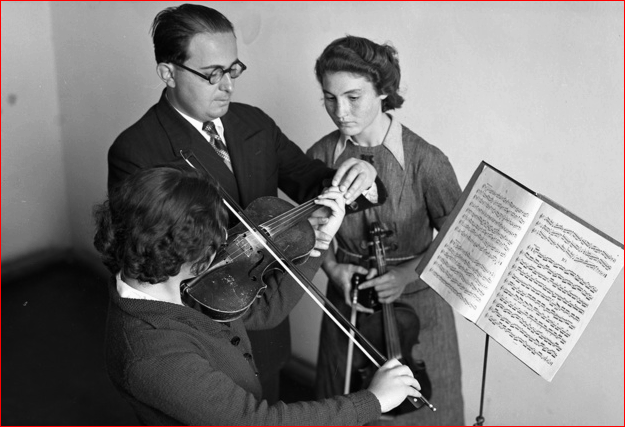
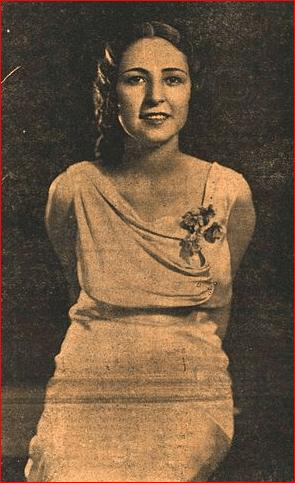
Kara-Keui (Galata )Bridge. Constantinople (Istanbul), Turkey. 1890-1900. sourceStatue of Atatürk. Ankara, Turkey. 1935 sourceAnkara, Turkey. 1935. sourceStudents of the Imperial Middle School. 1890. sourceAtatürk demonstrating Latin script, 1928. sourceMusiki Muallim Mektebi (Music Teacher’s Schooll), Ankara, Turkey. Founded Nov. 1, 1924. 1930’s. sourceWomen with face veils. Constantinople (Istanbul), Turkey. 1919. sourceMiss Turkey, 1932. Miss Universe, 1932. sourceFirst female MPs of the Turkish Parliament, 1935. sourceLatife Hanim ve Mustafa Kemal, 1924 sourceAtatürk, 1928. source
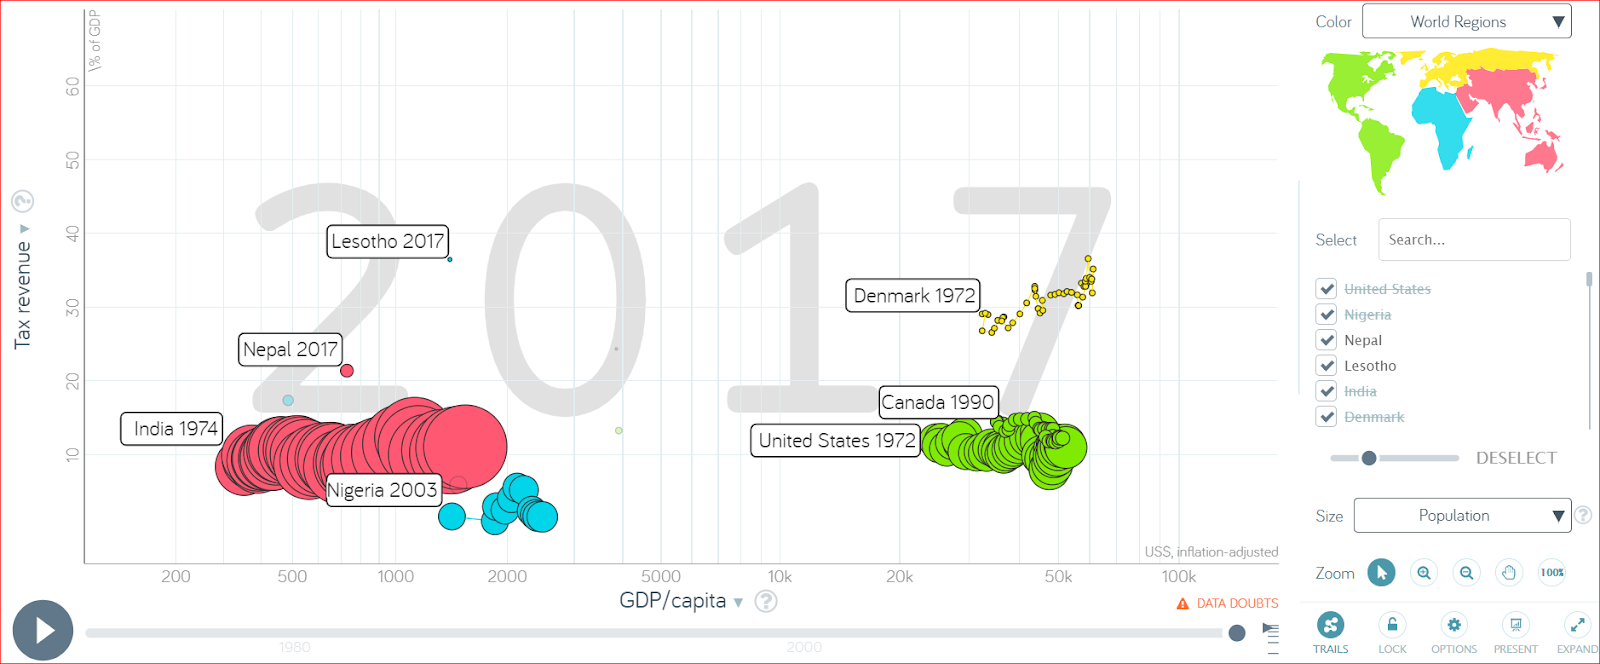
Gapminder.org tools could be used by students in conjunction with economics lessons on Gross Domestic Product (GDP), Inequality, & Trade. Last week, I presented a similar demonstration, that was presented to me by Peter in Methods, to my students who had just had a lesson on GDP. Initially, we talked about the use of inflation-adjusted GDP/capita on the x-axis of the Bubble chart display, as a reinforcement of their learning about nominal versus real GDP. Any number of searches crossing economic variables measured in terms of real GDP/capita with variables such as poverty, or average age of billionaires, to tax revenue, or inflation, could be explored.
An exploration of tax revenue as it relates to a country’s GDP/capita. source
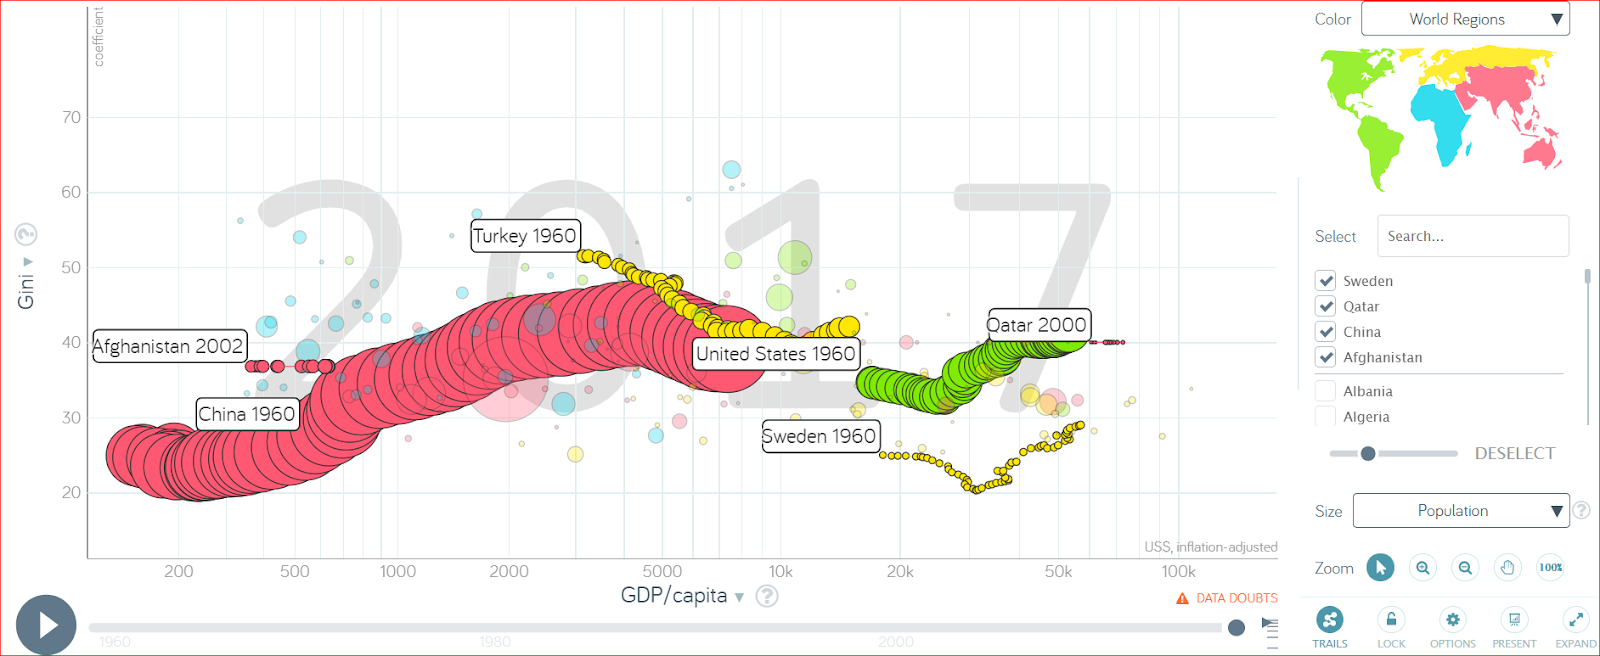
A concrete lesson activity, in conjunction with a lesson on alternative indicators of economic measurement, one could introduce the Gini coefficient with the Gapminder visual representation of life expectancy on the x-axis and the Gini coefficient on the y-axis. Students could self-select 3-5 countries to highlight and compare real GDP/capita v the Gini coefficient.
An exploration of the Gini coeffient as it relates to a country’s GDP/capita. source
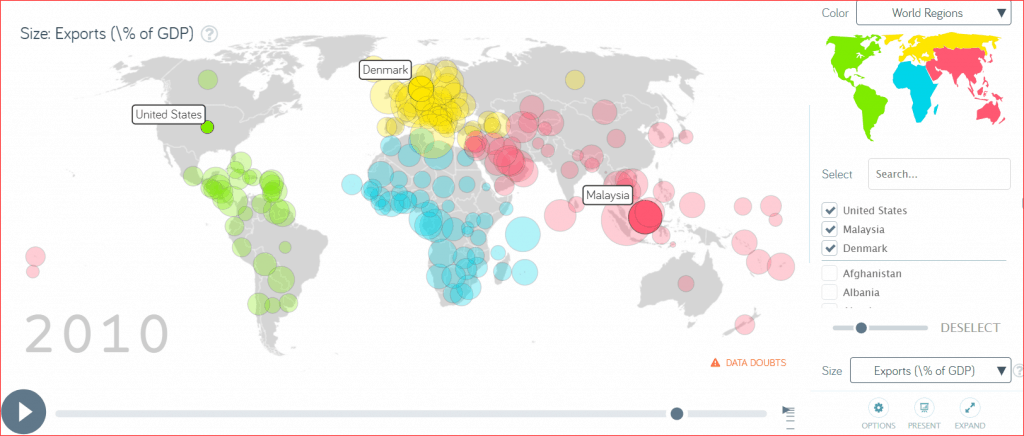
In addition, there are multiple avenues available to explore trade statistics. A potential activity for students is to explore export statistics is to select three countries and track them over time via “Exports/ % of GDP” and record their findings in a graphic organizer. For example, I selected US, Denmark, and Malaysia and selected statistics from 1965 and 2010. I found that US Exports/ % of GDP were 4.99% in 1965 and 12.4% in 2010. Similarly, for Denmark: 29.3% and 50.5%. Finally, for Malaysia: 45.1% and 86.9%. Students will then look at Imports/% of GDP for the same three countries. This is an opportunity for students to work independently or collaboratively, as well as, self-select countries based on their personal interests.
In my student teaching placement, I have tried small group discussion strategies. Last week, students independently read an article on measuring the health of the economy and then filled out a KWL chart together in groups of 3, or 4. (In the future, I will have students complete the K and L columns prior to the reading.) We then had each group select a representative to share a statement from each column of the chart. It led to an interesting class-wide investigative discussion on what people were wondering about with respect to GDP. The wondering of what county has the highest GDP, for example, led us into discussing country ranking of GDP and comparing that to a real GDP per capita ranking. The group went on the research alternative measure of GDP in their small groups and share with class some of the alternative indicators that some economists think are worthwhile in terms of understanding economic well-being.
Another discussion strategy that I have tried is Converstations, where students had an opportunity to post and discuss what they had learned and what they were still wondering with respect to the unit learning targets. This is a great activity to provide students with an opportunity to review and discuss material prior to a unit test. I had six posters located around the room and had students travel to the next station with the whole group. Once groups made it through the entire rotation, we came together as a class to review each poster topic for clarification. I like Jennifer Gonzales’s suggestion to have some students stay behind at the station to share with the next group what has been previously covered and discussed. Also, in my activity, I had about 6 students at each station. I think it would have worked better with less students in each group. There were a few off-task students and some who traveled on the periphery. Having more poster stations allowing for smaller groups is another adjustment I would make for a similar future activity.
What I’d like to try mid-unit or prior to a unit test is Send-a-Problem. Students will work in small groups of three and each given a flashcard to create a unit derived question for the group. The small group will come to a consensus on the appropriate question and answer for each flashcard in the group. The small groups will pass on the group of flashcards to another small group and receive a new set of questions from another team. Each set of review questions will rotate through each group. This seems like a fun, active, engaging way to spend 15 minutes on unit review.
I also like the Note to A Friend concept: giving students an opportunity to complete a 5-10 quick write at the end of a lesson. This is great way to utilize the last 5-10 minutes of class to reinforce content. I might also expand the concept to include sketching/cartooning as an option for sharing learning with a friend.


_LOC_matpc.16724.jpg)
.jpg)
.jpg)