Exploring History Vol VI

Exploring History VI

Every semester students publish a collection of historical thinking skills lessons in a showcase. In prior years we used iBooks Author. This year we switched to Microsoft Sway.

Here’s our Fall 2018 showcase.

American Reactions to the Vietnam War 
by Nick Krautscheid

Ending WWII
by Nicole Matier

War and Society
by Gabriel Bruneau

Equality on the Front
by Jana Peters

Westward to Equality
by Jordan Bonnell

Wounded Knee Massacre
by Nick Campagna


Class 14: Course Wrap Up

Today’s class will meet in the digital lab and complete our final projects using Sway. Students will then create one final blog post to showcase their Sway.

This final post should have a catchy title, featured image, brief intro to their lesson and use Sway’s “Visual Link” to to provide a connection to their Sway lesson from the post. See example of Peter’s Sway capture here.

Note: after you click “Get Visual Link” you will have the entire visual link (image and text)  on your clipboard. Just create an insertion point on your new blog post and paste. You will see the image thumbnail and text. The visual link will simply capture the beginning text of your Sway. You can edit that once it’s been inserted into the new blog post. 

Sway Visual link

A few more Sway housekeeping items.

1.  Make sure you have properly cited all content in your Sway. Could be done right at the doc or as endnote list.
2. When you are finished, export your Sway as a PDF and upload to TaskStream for your final assessment.
3. Check the settings for the Sway and make sure you agree with them.
4. Use the “Accessibility Checker” to see what accommodations can be made.  For example: identifying hyperlinks and providing visually impaired visitors alternative text for images.  


4. Be sure your Sway includes  “Lesson Designed by your name” and has a hyperlink back to the your author listing. The link is on the “Student Roster” Page. A “Control” or right click will get you the link to all your posts. (18A-1 through 18-A10)


END OF SEMESTER CHECKLIST
  1. Complete course assessment at SmartEvals
  2. All blog posts completed – see list here. You should have completed 10 – including the final “Sway” post.
  3. Create a PDF version of Sway and upload to TaskStream for final assessment.


Class 13: Lesson Design With Sway

Today’s class will meet in the Clark Library Digital Lab where we will begin design of our final project – a historical document-based lesson (DBL).

Your DBL will include:

  1. Essential question for student to consider. Open ended, invites discussion / debate. If possible phrase so it continues to be a relevant question.
  2. Introduction of the lesson with brief historical context as needed.
  3. About 5 – 8 related documents (image, text, video, audio) that will assist the students in exploring the essential question.
  4. A scaffolding question for each document to assist the student in examining the document.

We will be using Microsoft Sway as our design tool.

See Peter’s sample DBL made with Sway.

Go to this Sway

Each student will log into their UP Microsoft 365 account and design their own Sway. (They will also invite Peter as a collaborator.)

For assistance using Sway check these resources


Class 11: Teaching Social Studies with Data

Teaching Social Studies with Data

Quite often edtech tools are used by the teacher rather than the students and don’t do much more than make things prettier.
Think: Teacher at Smartboard as replacement for the overhead.

New digital technologies allows us to “see” information in new ways.
Think: Students analyzing a text using  Wordle    

History and other humanities that tended to be strictly narrative are leveraging  data collection and display tools to spawn a new digital / data approach to teaching history and social science.
See Digital Humanities Projects at Stanford

Many apps and websites can be a great tool to introduce the research method – form a hypothesis, gather and analyze data, revise hypothesis (as needed), draw conclusions, assess research methods. Working in teams students can easily pose research questions, run the data, revise and assess their research strategy. Students can quickly make and test predictions. They can then present and defend their conclusions to other classroom groups. All skills called for by the new Common Core standards.

In today’s class we will explore a sampling of free online data visualization tools that can be used in the classroom. Students will be asked to incorporate one of these tools into a lesson design.

Data-based tools

Text-based tools

  •  NGram Viewer – online research tool that allows you to quickly analyze the frequency of names, words and phrases -and when they appeared in the Google digitized books. For more advanced searches using NGram Viewer click here.
  • Google Trends – see how often specific keywords, subjects and phrases have been queried over a specific period of time.
  • The State of the Union in Context– compare use of words by different Presidents
  • Movies – dialogues of movie and TV shows

Map-based tools

Assignment 9 | Completed work

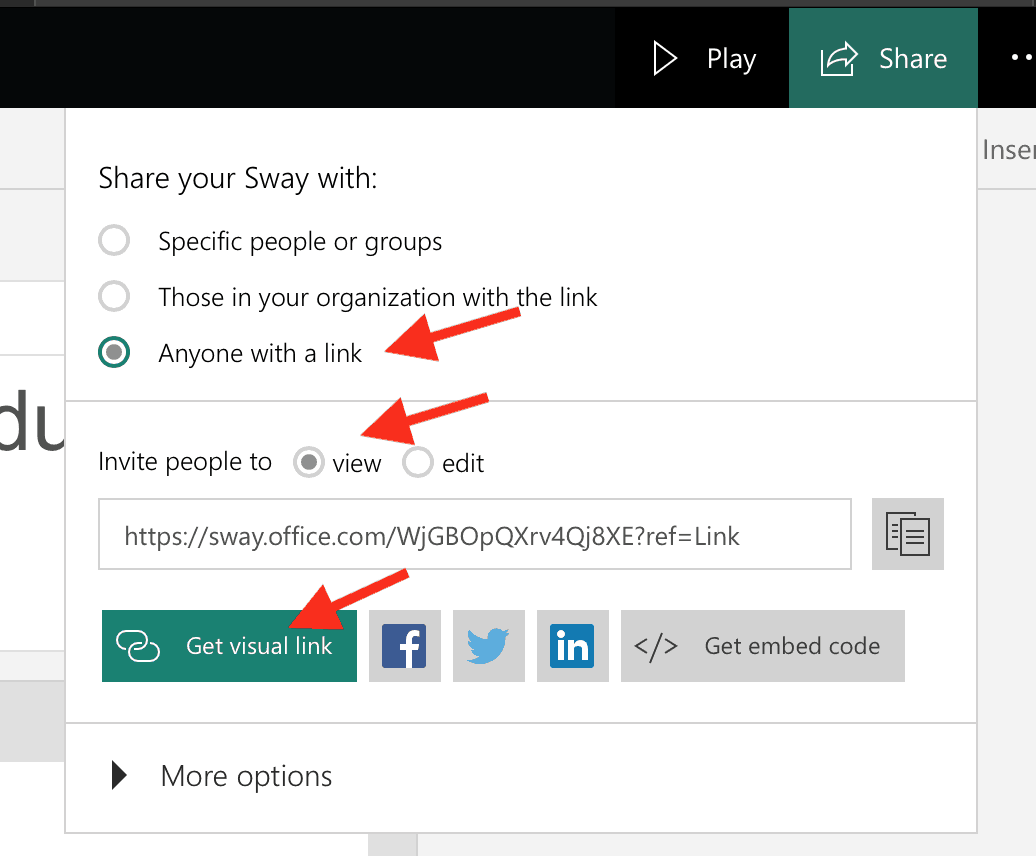
Choose one or more of these digital tools (or use a favorite of yours) and blog about how you would use it in an activity, lesson or unit. Be sure you focus on an idea that allows your students to be using the tool. Be sure to link to the tool and include a screen shot. If the digital tool allows results to be embedded in the blog. Here’s how to use HTML Snippets.

Image credits:Teaching with a SMART Board / Flickr