During my teaching last year in Taiwan I wanted to learn from my student as much as they learned from me. I spent time in and outside of class learning from my students, inquiring further on topics, getting their rationale behind an answer and seeking understanding behind cultural differences. Despite the large change of location, my inquisitive nature that roots my teaching remains. I didn’t know how to best articulate this teaching style until the end of the summer semester when Dr. Hetherington of the University of Portland School of Education described me as a co-learner. By including myself in the learning I am perceived as more accessible to my students and it enhances their communication skills, cultural awareness and critical thinking. I want to see my student’s greatest work and greatest potential and I believe that comes from allowing them to be creative, introducing and celebrating culture and fostering the knowledge in all through co-learning.
Project Showcase One standout example of a lesson I planned that encourages students to be creative and culturally conscious involves them doing a deep dive into the lyrics and instrumentation of Marvin Gaye’s What’s Going On? I ask them to take the drivers seat in interpreting the music and comparing the subject matter to modern America.
Continuing with a lesson that works at the top of Bloom’s Taxonomy by asking my students to produce work, this primary source activity studies modern Asian culture through a democracy movement. The activity consists of students reading primary sources and then asks them about the symbolism, to question the source and to make speech bubbles for the visual sources.
This third assignment was developed as a final portfolio piece: it is a very interactive, creative lesson concocted to aid my students in future economics decision-making. Students are run through a gauntlet of Google My Maps, Adobe Spark and Google Forms and placed in the shoes of someone who is a year out of college and looking for a place to live, a job and transportation. They are faced with the economics decisions behind these choices and real-life situations they may soon experience.
I have great drive and focus when it comes to planning creative pedagogy. I want to continue to work on this strength and continue using co-learning in my teaching experience.
Context: While the course work and curriculum in my economics class is graph and figure heavy, I want to work in some more conceptual, practical lessons. Last week when my co-teacher and I began our unit on taxes and W4 forms, we received praise in the Zoom chat for teaching ‘useful concepts’. I love a good supply and demand graph but I think my students have a point – there are concepts in the realm of economics that could really benefit all of them in the near future.
Therefore I have worked on a formative informal assessment embedded in a lesson that is meant to be used on the first or second day of a unit on personal finance and economic decision-making. It is a group simulation intended to introduce students to practical economic decisions they will inevitably make down the line. They will have to think critically about the advantages and disadvantages of a wage versus a salary, modes of transportation and budgeting. As of now, I have designed this lesson to have three groups. The three groups will have three distinct line of works assigned to them.
Guiding Question: Given the options provided in the Google My Maps and Google Form, what is the most efficient combination of transportation, work and housing for your group’s line of work?
Part 1: Group up and establish a line of work in the Google Form
The class will be randomly split up into three groups each with a different line of work based on their randomly assigned major. There will be different roles assigned once students are in a group. Amongst each group, they will decide their own form scribe, cartographer and bookkeeper. Other group members not assigned a role will help out wherever help is needed – primarily with input on the guiding question of determining the most efficient option. The form scribe will be in charge of turning in the Google Form in this first section, the cartographer will be mapping out routes between homes and jobs in part 2, and the bookkeeper will input data into the Google Sheet in part 3.
After discussing and weighing decisions posed in the Google Form below, the form scribe will turn in the form. The form establishes what jobs the group should be searching for in the map and accounts for some transportation costs.
Part 2: Scour the map for a job and a place to live
Below is a color-coded map for each group to look at together. The Google Form in part 1 will let each group know what color jobs you can choose based on your line of work. Keep in mind purple are wage jobs that any group can choose. In this part of the activity, the group should be looking at the cost of housing, salaries and wages for the jobs in the map. The cartographer is mapping out how far routes are between potential jobs and housing situations to measure the feasibility of their commute based on the mode of transportation chose in the Google Form.
Part 3: Enter data into the Google Sheet to see how your groups option pans out
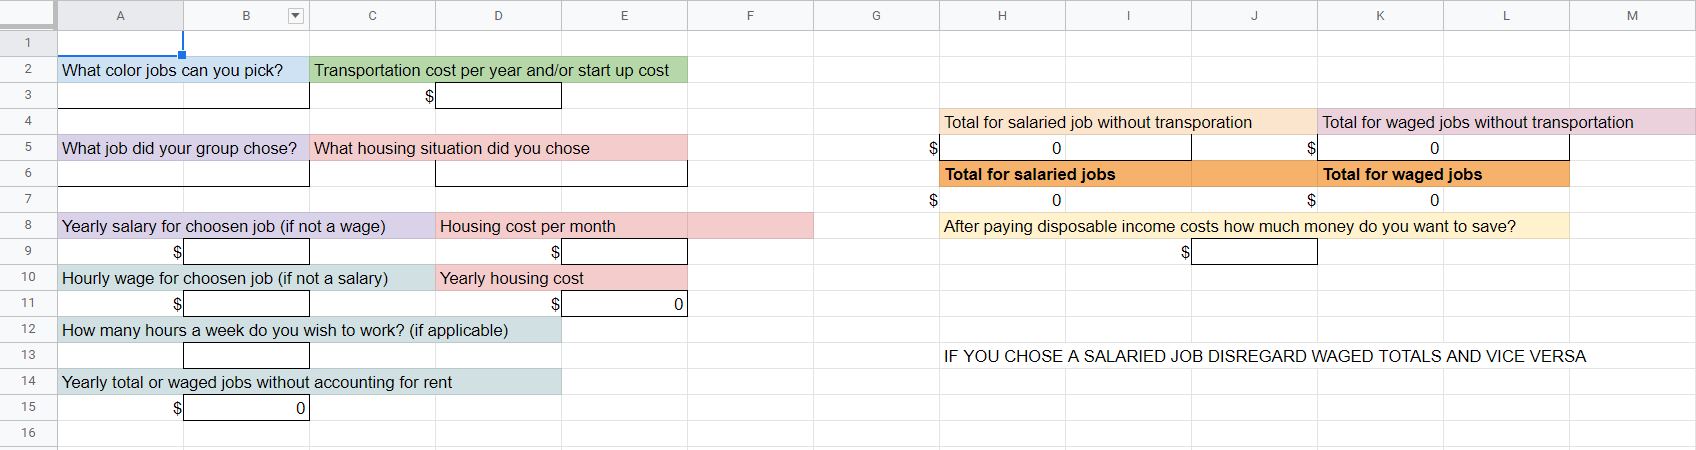
Groups will now help their bookkeeper as they enter information into the Google Sheet. There are formula’s already plugged into the sheet so things should total up as you move through the sheet. Groups will use data from this sheet in your presentation for the final step. The sheet might populate a total for wage jobs if you chose a salary job and vice versa but disregard it and only focus on the totals applicable to the job and housing your group chose.
Click on the image below to be hyperlinked to the fillable google form.
Part 4: Present your groups economic decision making in Adobe Spark
Once you have all your totals and have thought of some rationale behind the decisions your group made, make a short presentation for the class using Adobe Spark. Adobe Spark is a simple way to make an engaging multimedia presentation. Log into Adobe Spark and choose the video presentation function and make a short presentation explaining your choices with data, photos and any other media. Click on the image below to be linked to the Adobe Spark Video site. Groups will then present their choices to the class and actively listen to other groups as they too share.
Reflection: This lesson is a fun introduction to personal finance and contextualizes some aspects of economic decision making. A large majority of my students at Oregon City High School graduate and go on to either Clackamas Community College for a year or don’t continue their education at all after HS so this activity – if run in my class next trimester – has a subtle ulterior motive of encouraging students to think about higher education. A large part of the conceptual aspects of economics revolves around decision-making and opportunity costs; this activity is a practical look into that.
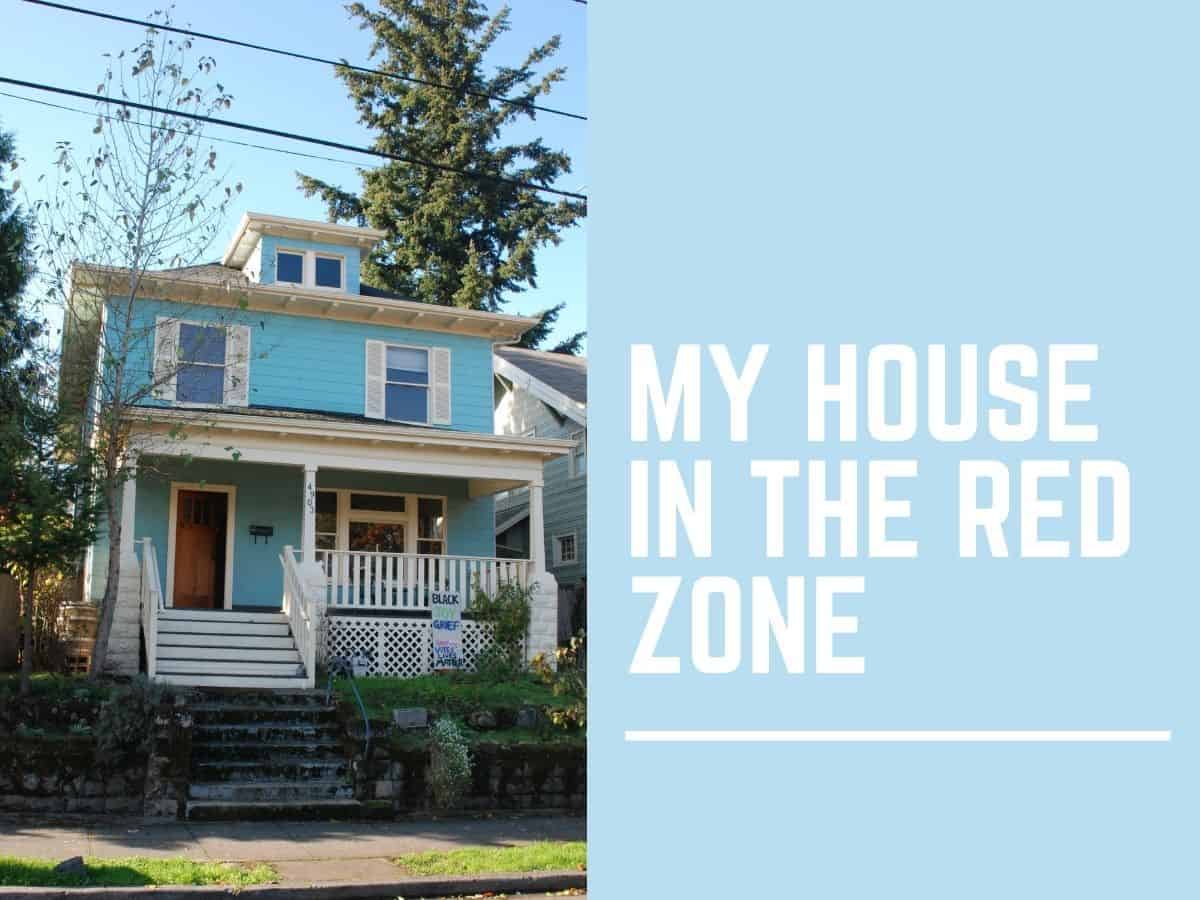
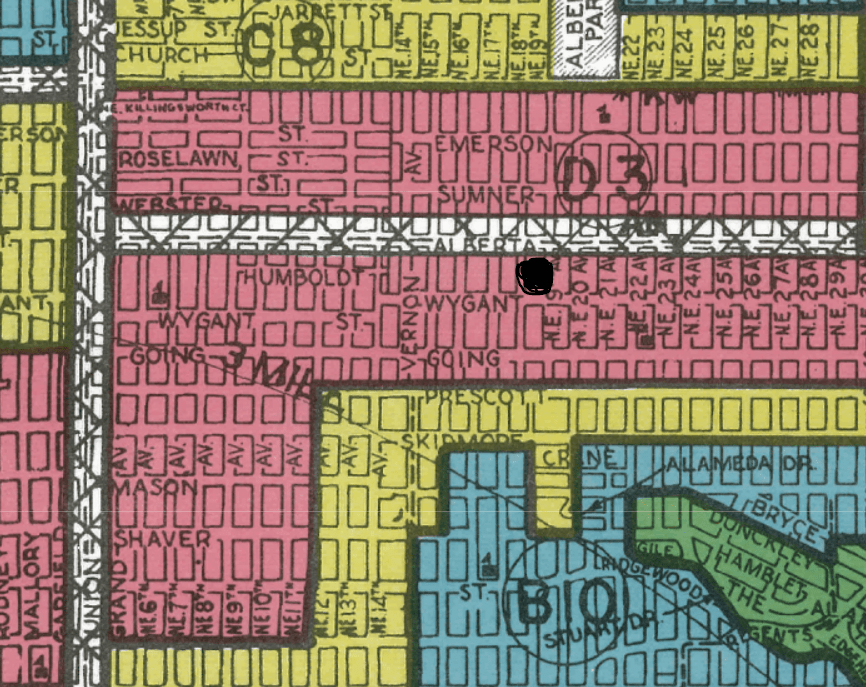
Since July of 2020, I have rented a room in a beautifully decrepit home in the Alberta Arts District of Portland, Oregon. While its façade is charming, the interior hasn’t changed since World War One. My landlord, who used to live in the house with her family is now getting her PhD in Madison, Wisconsin so she has been renting it out for several years to young folks like me. I marked on the map, provided by the website Mapping Inequality: Redlining in New Deal America, a big black dot to indicate where my home is. The map categorizes my house on 19th and Alberta as in a red “hazardous” zone that was predominantly Russian. For several decades after World War Two, Alberta would become increasingly Black before its impending gentrification around the turn of the century thanks to real estate business folks rebranding this part of Vernon the ‘Alberta Arts District’. When galleries began popping up on Alberta, real estate agents and real estate developers renamed this southern edge of the Vernon neighborhood of Northeast to make it more appealing to white residents interested in finding the next hip neighborhood of Portland. It’s not a history to be proud of but it is a history that residents need to be cognizant of. One thing that is particularly interesting about the image below is how if you follow 23rd and 24th street down from Alberta St. you can see there is 3 blocks of red, followed by one block of yellow, one of blue and then the Alameda Ridge in green. It’s a very quick transition as you head south towards Alameda which was originally zoned in 1924 as a covenant exclusively for single family homes. Nowadays I think the disparity gap between the quality of the housing throughout Inner Northeast is sufficiently closed and a home on 24th and Going is similar to one on 24th and Dunckley in marketability, price and safety.
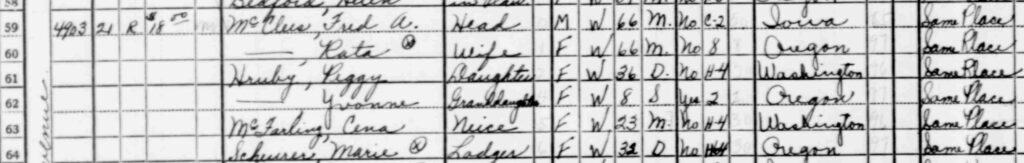
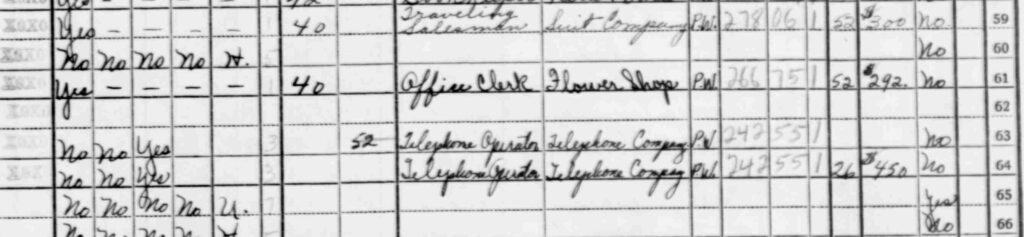
After viewing the 1940 US Census, I found that this home used to belong to the McClee family. Mr. McClee, 66 years old, was originally from Iowa. He met his wife Rata and settled in to this beautiful house in Oregon with their daughter, her 8 year old granddaughter, their niece and their nieces coworker. It looks like the nieces coworker, listed as a ‘lodger’ Marie, pays $18 a month for rent.
The head of the house Mr. McClee is a traveling suit salesman. His daughter is an office clerk at the flower shop and the niece and her coworker Marie work at the telephone company. Mr. McClee’s yearly salary is $300 which according to an inflation calculator is a little shy of $5,600 a year. I am assuming money was tight because this home was in a ‘red’ zone and there are clearly a lot of adults living in the house working and contributing to help pay bills.
I am deeply saddened to report, I am moving out of this house on Friday. This assignment serves as a send-off and a celebration of its history.
While campaigning at The Ambassador Hotel in Los Angeles, on June 5, 1968, Bobby Kennedy left the ballroom after an address and found himself in deep trouble. He went through the hotel kitchen despite being advised by his bodyguard to avoid that area of the hotel. In a crowded kitchen passageway, Sirhan Sirhan opened fire and Kennedy was hit three times killing him. I think Bobby Kennedy was ahead of his time in terms of his social policies. What would have happened if he wasn’t assassinated? Would he have become president? What policies would he have enacted? Could he have halted the Vietnam War and passed legislation to aid race relations and socioeconomic issues?


