Chronicling America – Giving the Text Context

8th Grade Humanities Class

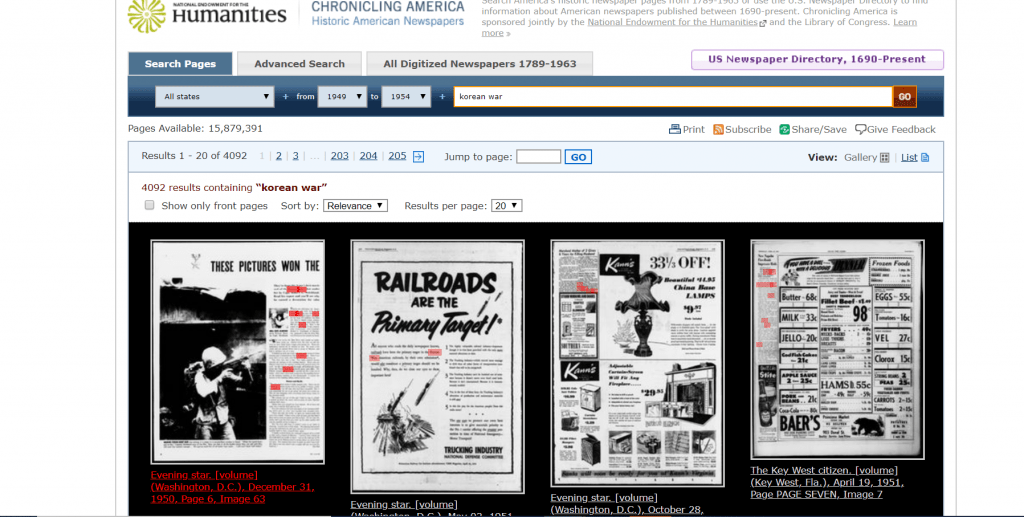
For this lesson, I would use Chronicling America, the resource upon which you can look at digital copies of newspapers from a period up till about the 1960’s, in conjunction with the reading of The Outsiders text. This activity would take place at the beginning, right before students will actually begin to read the text. It would have students look up newspaper articles from the 50’s and such in the Midwest, particularly Oklahoma, where the story of The Outsiders takes place. This lesson would begin with an intro to how daily life and the roles of people in society were drastically different during the 50’s and 60’s in midwestern America and highlight some of the ways or places in which differences might be found.

Students will be introduced to Chronicling America as a resource to be able to better understand and give context to the happenings and life of the midwest in the 50’s and 60’s. The teacher will demonstrate. The teacher will then show an example of an article from the site that will set an example of highlight a part of midwest life during the time period. The teacher will ask the students to reflect and how this highlighted experience is different and or similar to experiences with this aspect of life in today’s times.

Students will then be asked to go into the Chronicling America sight and choose their own article or part of an article that highlights an aspect of midwest life at this time. They will be asked to provide a screenshot of the part of the newspaper they are using and in at least 3 sentences, describe what is going on and some similarities and differences between that idea, place, or object in that context and the context of the world in which they are living in today.

As an exit ticket, 3 students will be asked to share something that they learned from their research in terms of what may be different or similar between the midwest life of that time, around when The Outsiders text is centered, and the time and context of their lives today.

Data Visualization with The Korean War

Chronicling America” is an extremely valuable tool educators can utilize in their classrooms for a variety of lessons. This subsection of the “Library of Congress” allows users to sort through a collection of digitized American newspapers from as early as 1789 to as late as 1963 with many ways to filter results. While the time limitations do restrict the user from exploring aspects of history outside of America during 1789-1963, the website nonetheless provides excellent value in allowing students to analyze primary source documents when utilized correctly.

One idea I have for using this tool is a lesson for a beginning portion in a Korean War unit. Known as the “Forgotten War”, students would utilized primary source documents to determine how the general public interacted with and perceived the conflict. Due to the large number of filters, students could see how public perception towards the conflict changed from early on in the war (using the filter to only view newspapers during the years 1950 and 1951), in the later years of the war (1952 and 1953), and the students could even discover if perception towards the war was different based on the state (using the tool to isolate certain state newspapers). Below is a screenshot of a filer setting that would look at the entirety of the war, including the aftermath with the year after the war included, of the entire nation (did not isolate the search to one state).

Source

While this is a large endevor for any single student, I would likely pair up students into groups of three, where each group would be responsible for the three following activities:

  1. Examine public perception towards the Korean War in the early stages of the conflict (1950 and 1951). Use at least four newspaper articles for your analysis of the nation’s perception of the war as a whole, and individual states’ views of the war (choose at least two different states).
  2. Examine public perception towards the Korean War in the later stages of the conflict (1952 and 1953[before 28JUL1953]). Use at least four newspaper articles for your analysis of the nation’s perception of the war as a whole, and individual states’ views of the war (choose at least two different states).
  3. Examine public perception towards the Korean War following the conflict (28JUL1953 and later). Use at least four newspaper articles for your analysis of the nation’s perception of the war as a whole, and individual states’ views of the war (choose at least two different states).

Such an activity would allow students to have greater interaction with primary sources all in an effort to learn about a topic unfamiliar to the general American public. In addition, this activity would allow the students to become the historians and put the learning in their hands.

Teaching With Data

For this activity students will explore internet trends and pose questions about the nature of human curiosity with the help of Google Trends.

Students will compare two people, topics, or themes using google trends. After reviewing the data students will use prior knowledge to form a list of possible explanations for the changes in search trends over time.

Students will then search for connections between changes in trends and current events to explain the fluctuations over time. For example: the release of Hollywood biopics depicting the lives of The Notorious B.I.G. (Notorious, 2009) and Tupac Shakur (All Eyez on Me, 2017).

Using data from Google Trends and results from their research, students will then answer the question: “What aspects of American Culture have the greatest impact on our interests and curiosity?”

Exploring Economics Through Data Visualization Tools

Gapminder.org tools could be used by students in conjunction with economics lessons on Gross Domestic Product (GDP), Inequality, & Trade. Last week, I presented a similar demonstration, that was presented to me by Peter in Methods, to my students who had just had a lesson on GDP. Initially, we talked about the use of inflation-adjusted GDP/capita on the x-axis of the Bubble chart display, as a reinforcement of their learning about nominal versus real GDP. Any number of searches crossing economic variables measured in terms of real GDP/capita with variables such as poverty, or average age of billionaires, to tax revenue,  or inflation, could be explored. 

An exploration of tax revenue as it relates to a country’s GDP/capita. source

A concrete lesson activity, in conjunction with a lesson on alternative indicators of economic measurement, one could introduce the Gini coefficient with the Gapminder visual representation of life expectancy on the x-axis and the Gini coefficient on the y-axis. Students could self-select 3-5 countries to highlight and compare real GDP/capita v the Gini coefficient.

An exploration of the Gini coeffient as it relates to a country’s GDP/capita. source

In addition, there are multiple avenues available to explore trade statistics. A potential activity for students is to explore export statistics is to select three countries and track them over time via “Exports/ % of GDP” and record their findings in a graphic organizer. For example, I selected US, Denmark, and Malaysia and selected statistics from 1965 and 2010. I found that US Exports/ % of GDP were 4.99% in 1965 and 12.4% in 2010. Similarly, for Denmark: 29.3% and 50.5%. Finally, for Malaysia: 45.1% and 86.9%. Students will then look at Imports/% of GDP for the same three countries. This is an opportunity for students to work independently or collaboratively, as well as, self-select countries based on their personal interests.

Exploring trade on gapminder.org. source