“When students dive headlong into writing poetry, when they share the living, beating heart of their own words, when they hear the pulse of joy and rage from their classmates, they are hooked”
Linda Christensen & Dyan Watson – Rhythm & Resistance
The words above may not represent the work of a social studies teacher, but they do get at the heart of what it means to teach. It is about imparting, discovering, and sharing the passions we have in the classroom, both students and teachers alike. When we are able to hitch our feelings of joy to the practice of learning astounding things are possible.
Over the weeks spent in this Social Studies Ed Methods course, I’ve been given the opportunity to explore my passions and interests in history and civics. Each assignment was open to my own interpretation and what ever material I wanted to pursue was valid. This virtual portfolio demonstrates the growth I’ve made over the course of this semester as well as my own interests within Social Studies. Many of my posts focused on the stories of oppressed people and minorities.
Additionally here are the posts where I focused on my other interests: German History, Western Expansion, the Political Divide in American Politics, and the Cold War.
Essential Question: How is the legacy of Vanport still felt in the city of Portland today?
Assignment: Read the following history of Vanport, Oregon. Once done reading watch the short film by the Oregonian and examine the photos and guiding questions. You will be investigating the events of Vanport and answering our essential question by writing 2-3 sentences in your notebooks.
Vanport was the largest Federal Housing Development at the time of its construction in 1942. The city was founded on a tract of unincorporated swampland in Multnomah County, Oregon along the banks of the Columbia River. Its name was a portmanteau of its municipal neighbors: Portland, Oregon and Vancouver Washington . The city was constructed during WWII as a public housing estate for the workers and their families employed at the Kaiser Shipyards.
By the mid-1940s Vanport became Oregon’s second largest city with some 40,000 residents, of which, 40% were African-Americans. Despite the fact that Vanport was built with federal funds and constructed after Executive Order 8802 – which banned discriminatory employment practices by Federal agencies and all unions, local officials still enforced de facto segregation. In Vanport, only three sections, a total of 50 buildings were allotted to black residents. Moreover Vanport was one of only two housing projects in the Portland area that accepted any blacks. Despite this low number of residential housing dedicated to African-Americans white residents in neighboring Portland called the area “the Negro Project”.
Portland had long had a reputation of prejudice and racial discrimination; a city where the African American population had been kept intentionally small and economically and culturally marginalized. Because of this legacy only 2,000 African Americans lived in the city prior to WWII. Oregon, outside of Portland, had an even smaller black population due to its legacy as a “sun down” state. The state constitution had prohibited blacks from residing in the state. The state also was also a stronghold of the Ku Klux Klan; by the end of the 1920s there were 35,000 Oregonians who were members of the hate group.
By the end of the war in 1945, Vanport’s population shrank to roughly 19,000 of which approximately 4,000 were African Americans who continued to live in Vanport while another 5,000 were crowded into the nearby Albina neighborhood in Northeast Portland. Many African Americans in the city continue to believe that local government officials kept Vanport open, despite its slowly degrading infrastructure, because they did not want more blacks to move into Portland city limits.
In 1947 the Oregon Journal conducted a series of articles investigating Vanport and how it had become an “eyesore” in the eyes of surrounding communities: “To many Oregonians, Vanport has been undesirable because it is supposed to have a large colored population,” The articles continued,”Of the some 23,000 inhabitants, only slightly over 4,000 are colored residents. True, this is a high percentage per capita compared to other Northwestern cities. But, as one resident put it, the colored people have to live somewhere, and whether the Northwesterners like it or not, they are here to stay.”
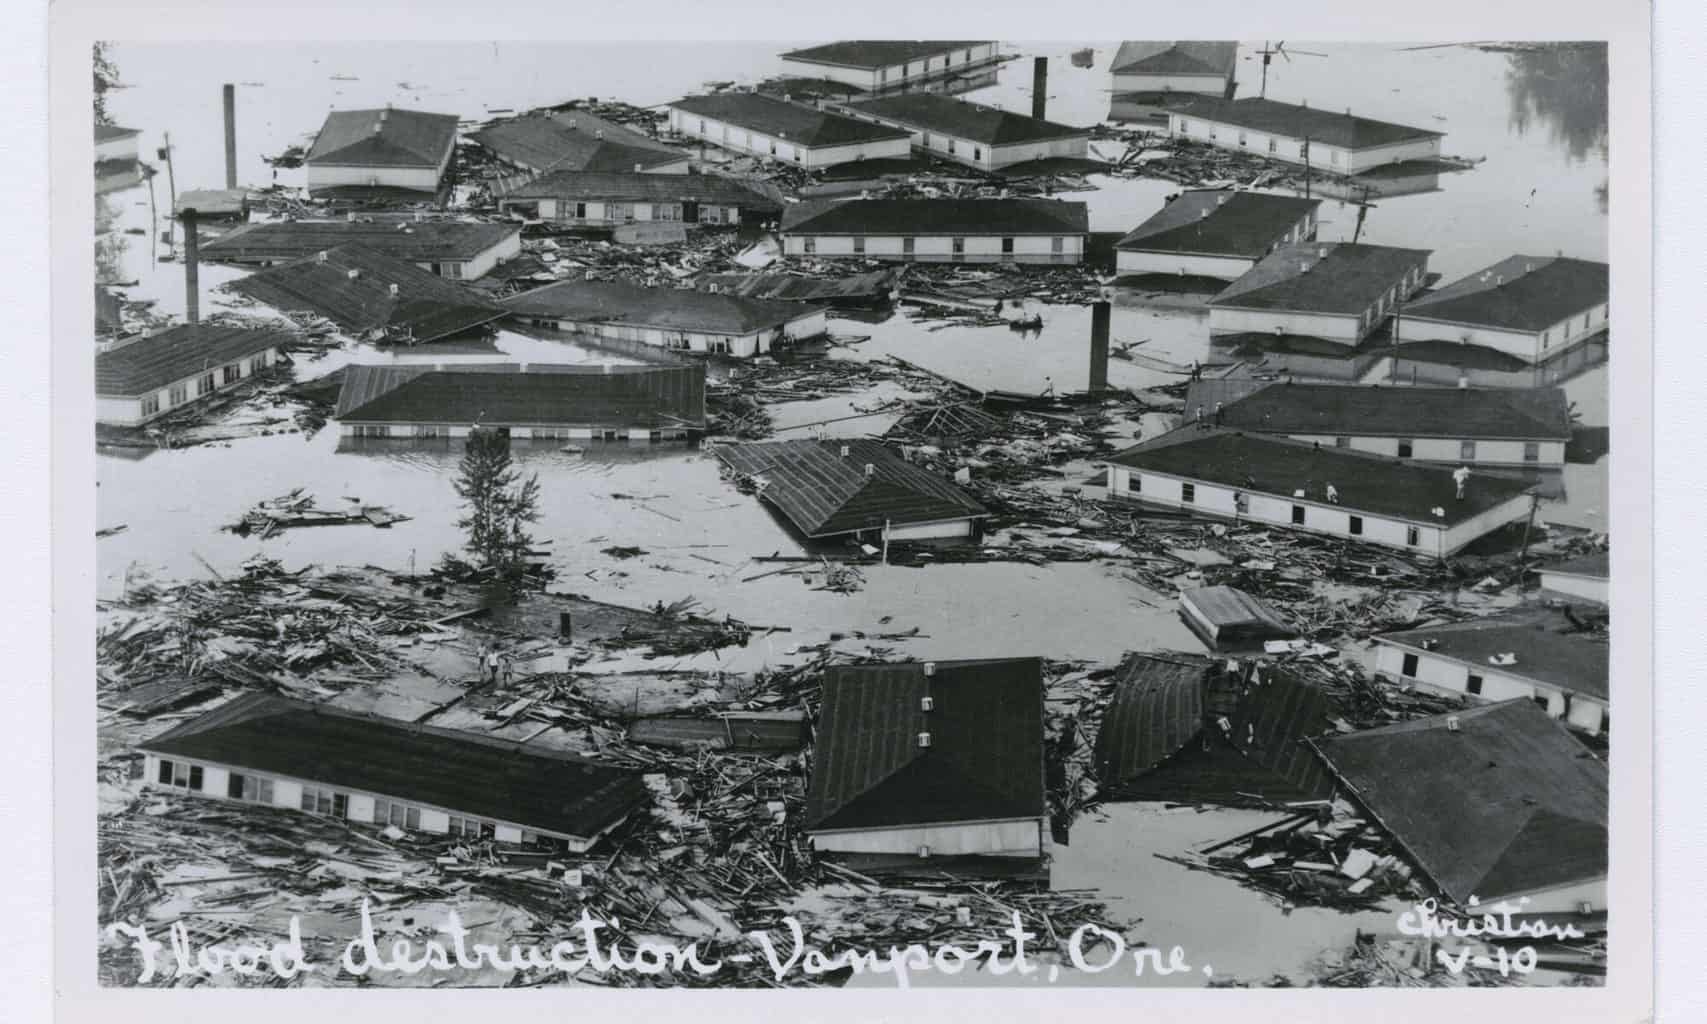
An unusually wet winter and two rainstorms combined to a create a perfect storm on Memorial Day May 30, 1948. A hole developed in the railroad dike blocking the Columbia River, and it erupted into massive flooding. City officials didn’t warn residents of the dangerously high water levels and choose to not issue an evacuation. Due to the holiday few residents were at home at the time of the flood, contributing to low loss of life. Despite this 15 people lost their lives as a 10-foot wall of water swept through the city. Many residents became trapped in their vehicles as the only exit out of the city became choked. The city was declared a total loss by day’s end.
The scale of the tragedy temporarily overcame the legacy of racial discrimination in Portland. White families opened their homes to displaced African American families. This act of mercy was short lived as racial lines that existed before the flood arose again as black families sought new homes. African American residents displaced by the flood equaled the entire population of Albina. It became virtually impossible for these residents to crowd into the only areas they were allowed to buy homes and cause neighboring independent towns and neighborhoods, like Kenton, to absorb the dispalced.
Despite its short life span, Vanport helped create several “firsts” for Oregon and the Portland area. The first black teachers and policemen in the state were hired in Vanport during the war years. The Vanport Interracial Council worked to establish a Portland office of the Urban League. Vanport College was the precursor to Portland State University where many veterans used the GI Bill to get a new start on life. In the end, Vanport became part of the story of civil rights and African Americans in the West.
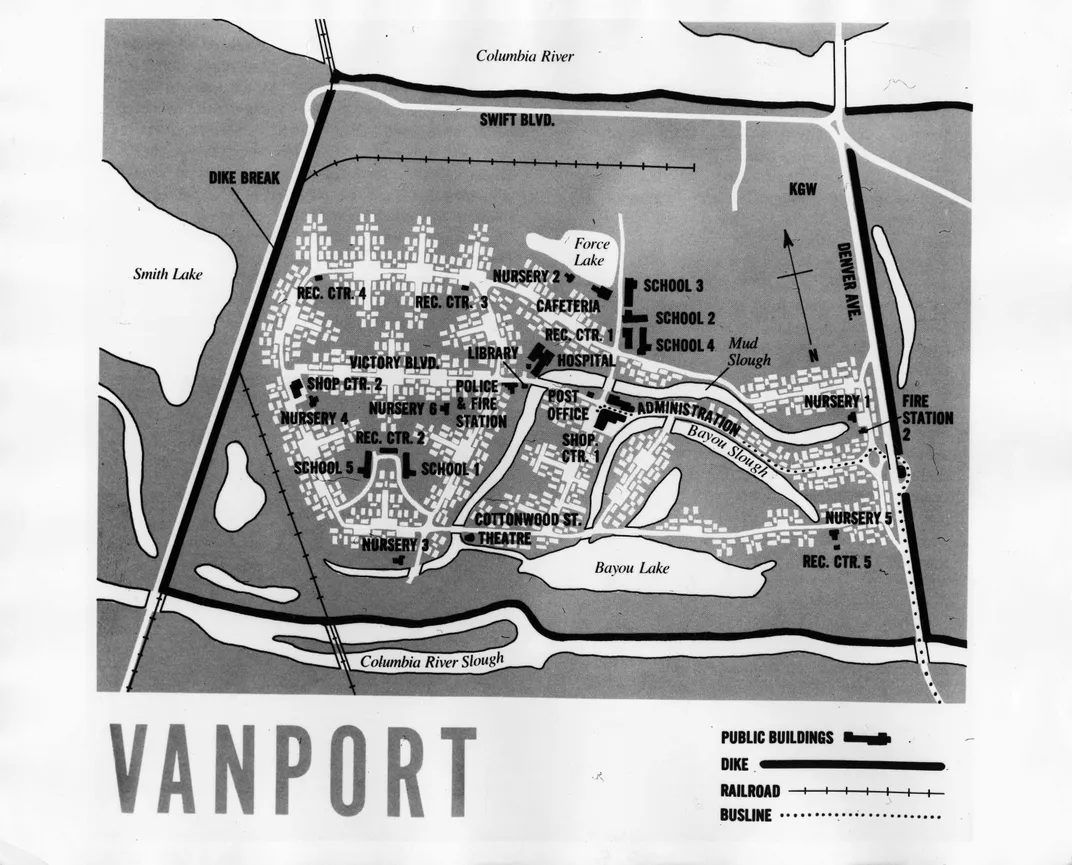
Based the map above, is there anything about the design of the city that may have contributed to its destruction or the loss of life?
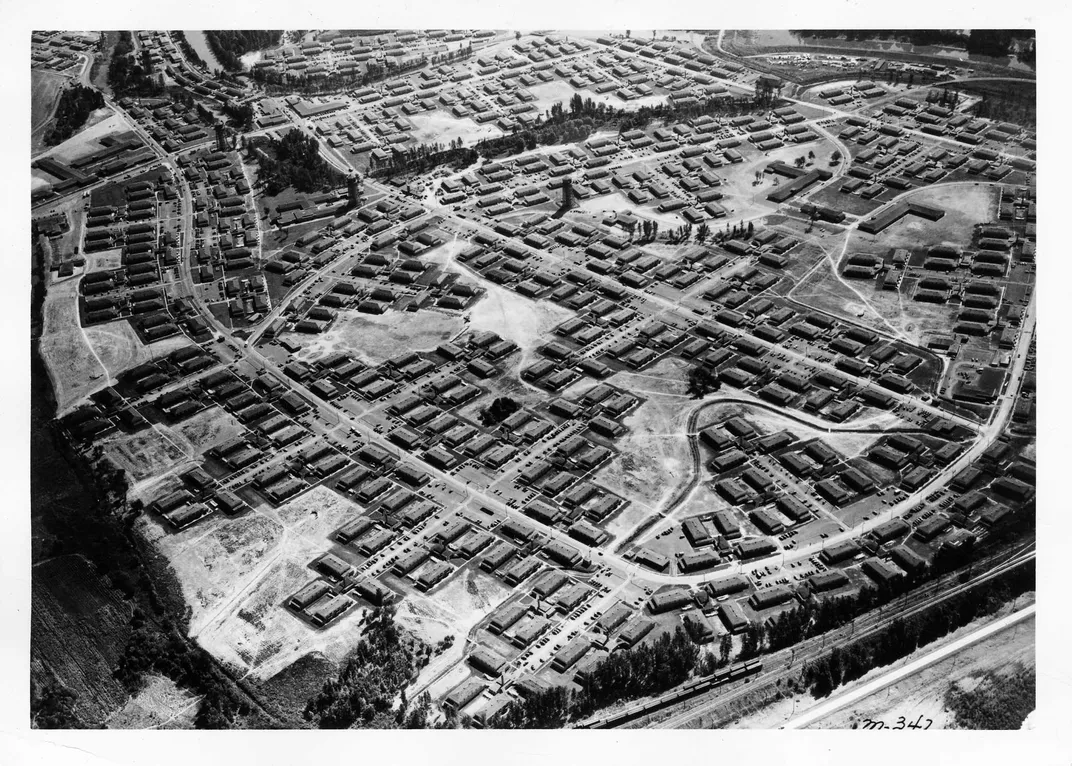
Image from Portland Housing Authority ArchivesImage from Oregon Historical SocietyImage from Oregon Historical Society
The three photos above show Vanport during its heyday. What aspects of this community made it an attractive destination for migrant workers and their families? Why would so many African Americans be drawn to this area – was there something occurring in other parts of the United States that would have led them to migrate?
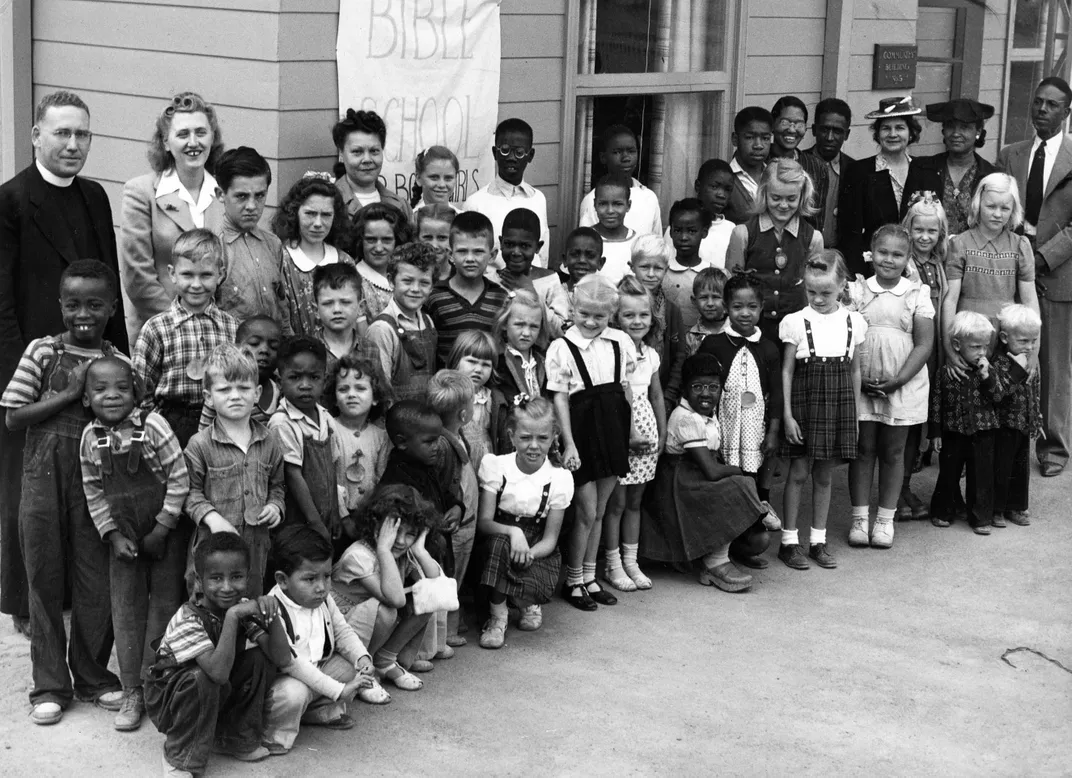
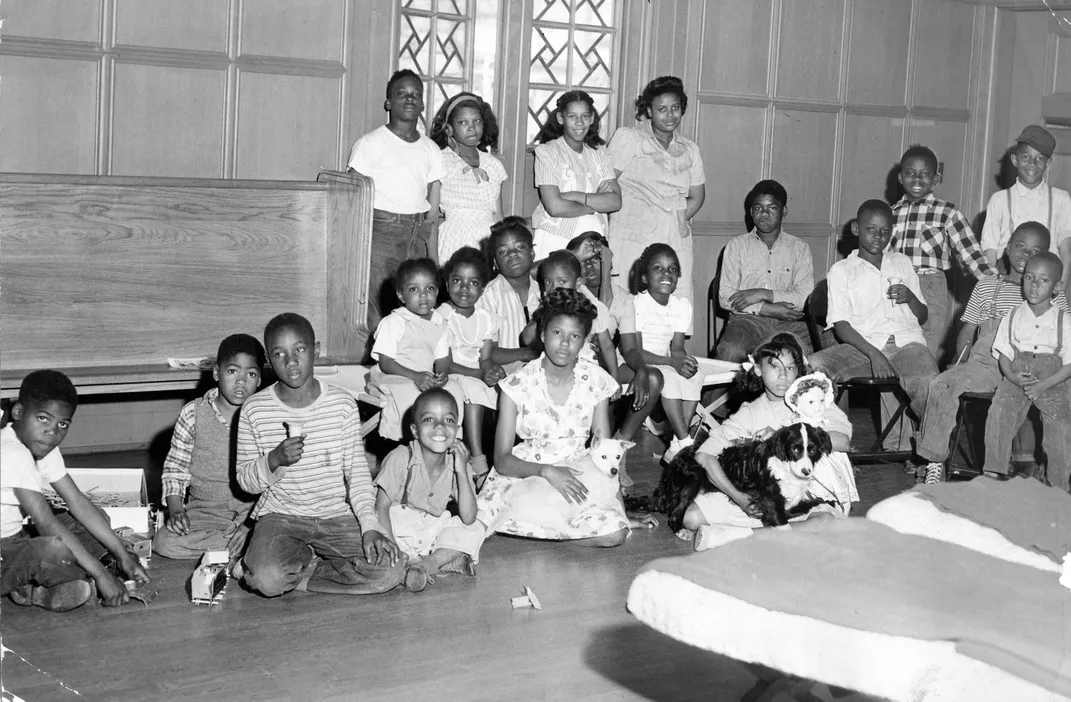
The above photo is of Vanport City Vacation School in August 1943. What do you think of the racial makeup of this class? How do you think residents in Portland would have reacted to this class?
Image from Oregon Historical SocietyImage from Oregon Historical SocietyImage from Oregon Historical Society
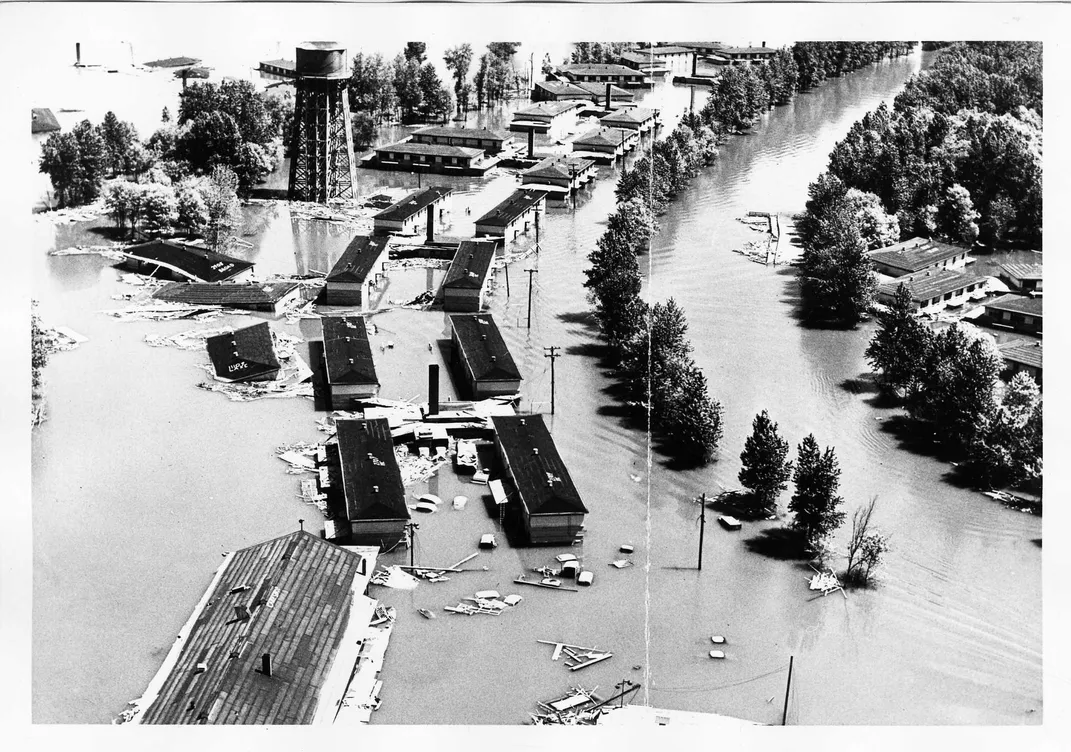
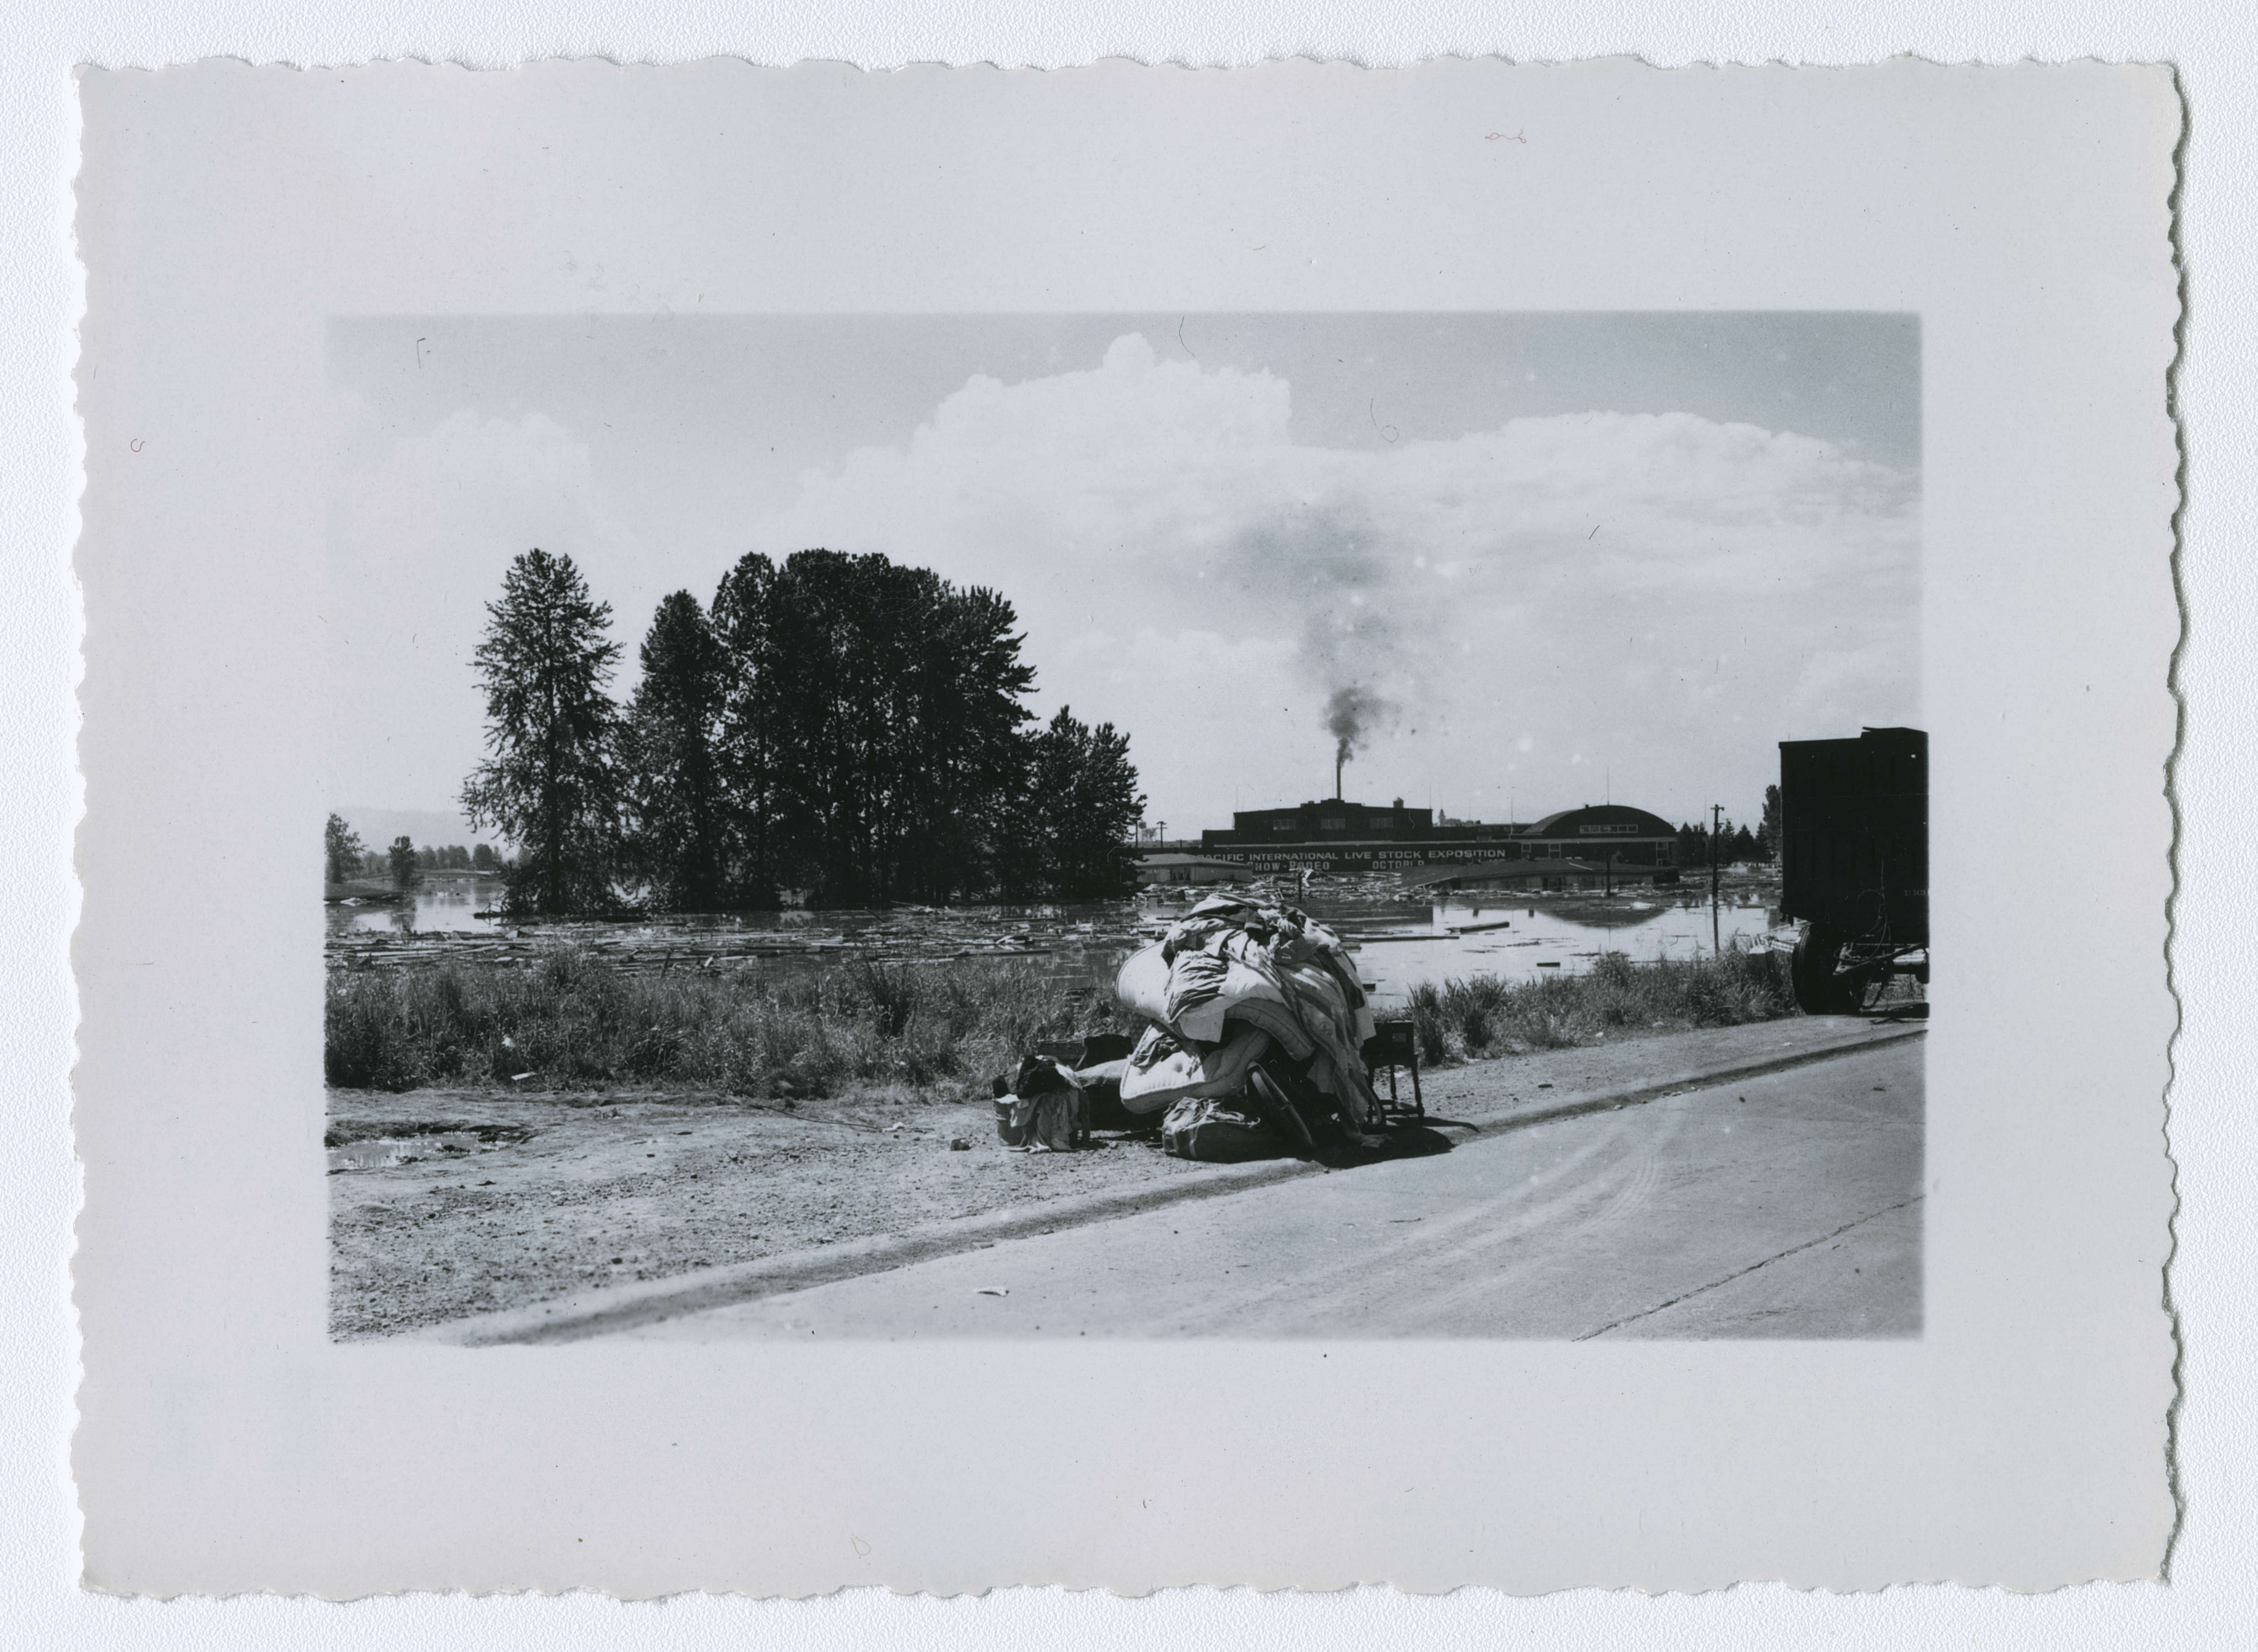
The above photos show the Memorial Day flood and fleeing residents. The city of Vanport was completely destroyed by the flood and residents had little time to escape. What does this mean for the residents in terms of their livelihoods and possessions?
Image from the Oregon Historical SocietyImage from Oregon Historical Society
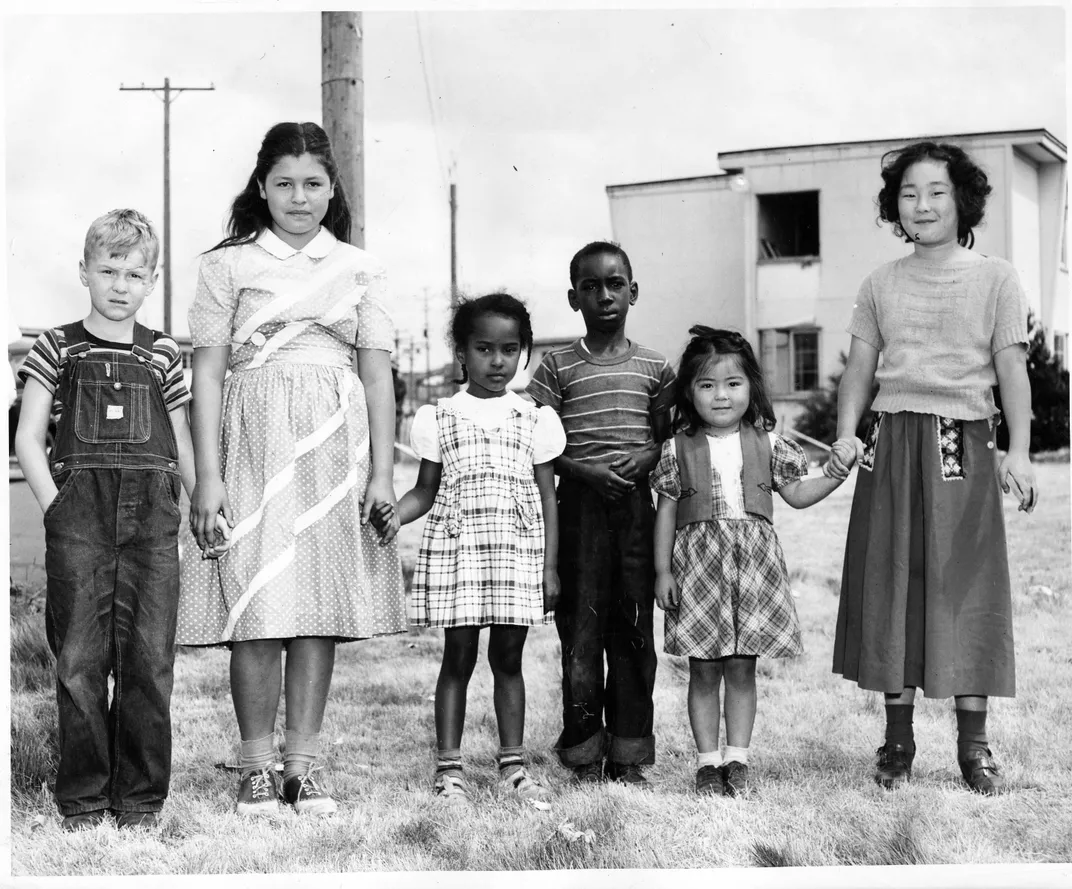
The above photos show refugee children from the flood. Vanport was not rebuilt following the flood. Where would these children and their families move to? How did segregation in Portland effect these children differently?
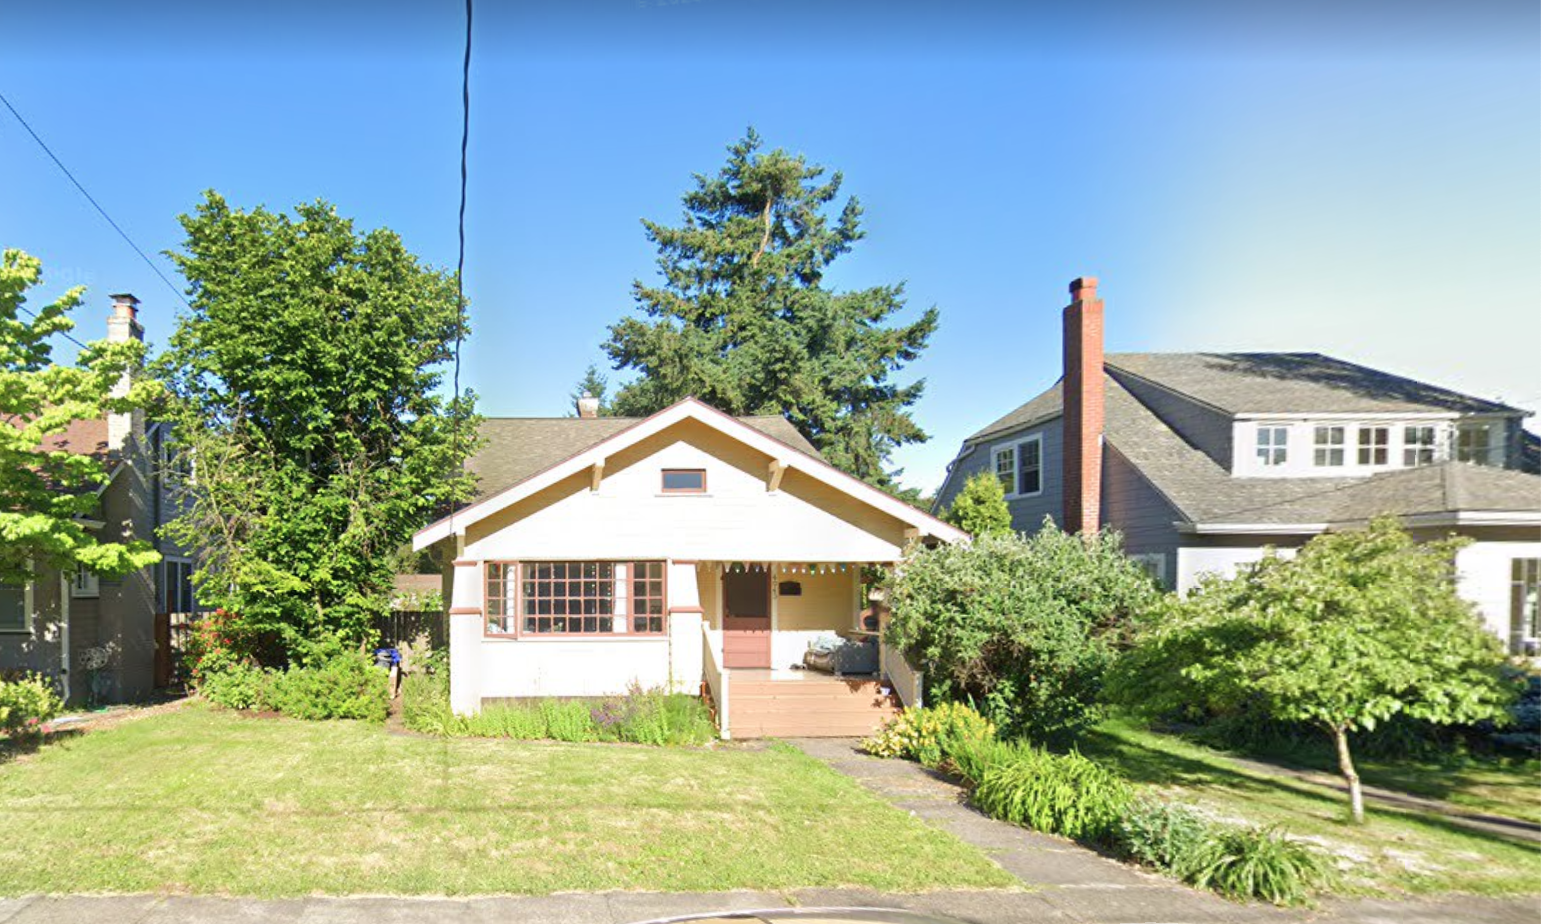
For the 11 years that I have lived in Portland, 6 of them have been in the same home at 4043 NE 23rd Avenue in the Sabin neighborhood. I shared this home with a group of folks that I consider to be found family. As a queer man I recognize that family is not only those that share your blood, but includes those who share experience and deep understanding of each other. In this home we saw so many important moments: couples marry and separate, two children be born and have their first milestones of life, holidays and parties, fights and reconciliations, meals and music. It was a good and happy home.
We were the odd house on the block; in a sea of single-family homes, we were one of the few rental units on the block. Our neighbors were curious at best of the place that had 6 adults sharing one roof and at times were opening scornful and cold. We frequently had neighbors ask about how many cars would be out front, who would be maintaining the yard, and in one memorable moment, ask us to not be seen outside while an open house was going on next door. It was often clear that our neighbors worried about what our presence would do to the perceived property values of their own homes.
Our block of 23rd Avenue between Alameda and Mason streets is a transition zone between the ultra-wealthy and expansive homes along Alameda Ridge to the more middle-class neighborhoods surrounding the Alberta Arts District. We didn’t know much about the history of the home; but when we moved in we used Portlandmaps.com to learn that it had been built in 1920 and that our landlords had purchased it in 1990 for $55,000; by 2020 the market value of our home had risen to $510,000. This is part of a wider trend of home value increases and gentrification not only for the Sabin neighborhood and NorthEast, but for the whole city of Portland, as well.
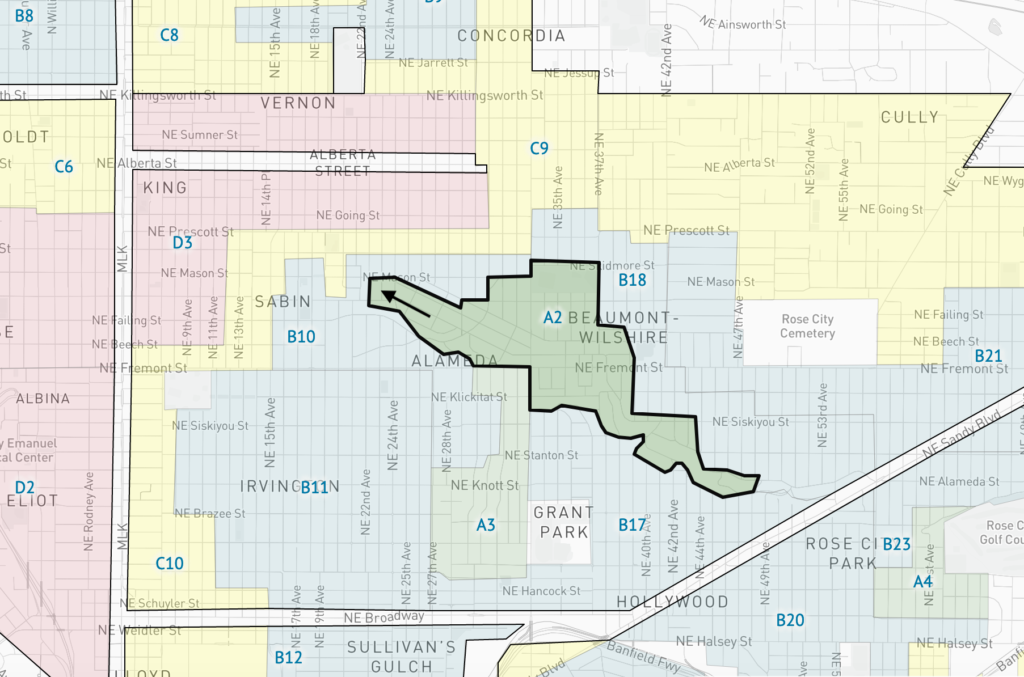
Using the Mapping Inequality website, in 1940 my home was considered at the edge of a residential area graded as green or “Best”. There were no subversive groups present, no African-Americans, labeled as “negros” in the material, no relief families, and little chance of infiltration. The majority of homeowners had occupations that fell into the category of “Business & professional men- executives, etc.” Yet despite this designation, at the north end of the block, the designation begins to change rapidly. NE 23rd Ave, from NE Mason to NE Skidmore (a distance of one block), is downgraded to Blue or “Still Desirable” due to the “Proximity to subversive racial elements”. From NE Skidmore to NE Prescott, NE 23rd Ave is downgraded again to Yellow or “Definitely Declining” due again to the “Proximity to subversive racial elements” and “Some streets unimproved”. And finally with the start of the next block, NE Prescott, and stretching north for 6 blocks up to NE Killingsworth, NE 23rd is downgraded to Red or “Hazardous”. This area contains subversive groups, is 35% Russian, has 21 African-American families, and “many” Relief Families.
Arrow indicates where my home was located.
In 1940 this Hazardous neighborhood was perceived as an almost socio-economic Black Hole, its gravity pulling the surrounding areas down with it. It’s Trend of desirability for the next 10-15 years is rated as Static or Declining. It seems obvious today that designating an area as “Hazardous”, “in decline”, and as a threat to surrounding neighborhoods does nothing to alleviate to any issues that may exist within the area. It does nothing but help perpetuate the cycle of poverty by discouraging investment and development. Also, if the designations of Hazardous are based purely on the racial and/or ethnic background of the place, it is an impossible (and bigoted) metric to judge by. People will stay Russian or African-American, that cannot change. People who are Russian or African-American will always need a place to live, work, and raise families; their existence cannot be considered Hazardous.
I can’t help thinking about what my own household would have been like in the 1940s based on the criteria listed. In my time at 4043 NE 23rd my household included a Russian-American Jew, a Korean immigrant, a Mexican-American ex-convict, two gay men, a transsexual man, a mix-raced child, and a child born out of wedlock. We often joked amongst ourselves that we were a Conservative’s worst nightmare. In 1940 however I can’t help but think we were the poster child for a Hazardous home. I doubt that if our home had been a rental unit in 1940 we would have been allowed to rent it, or inside of it for that matter.
In the years following 1940 this area of Portland became increasing Black. Alberta became the heart of a vibrant neighborhood with African-American owned businesses and cultural centers. However, the legacy of Redlining, the systematic denial of services, especially financial services to groups of people based on race or ethnicity, caused Portland’s African-American population to be concentrated, and often, excluded from the opportunity of home-ownership. By the early 1990’s when The Oregonian broke the story on Redlining through its series Blueprint for a Slum some homes in the area were only selling for $3,500; ironically, the same price as my home was worth in 1940. The lack of traditional lenders for African-Americans led desperate would be home owners to turn to risky financing; in this case loans offered by Dominion Capital Inc. Buyers would purchase loans unaware that Dominion had loaned more than what the properties were wort. This predatory behavior was ignored by the Attorney General until the story broke.
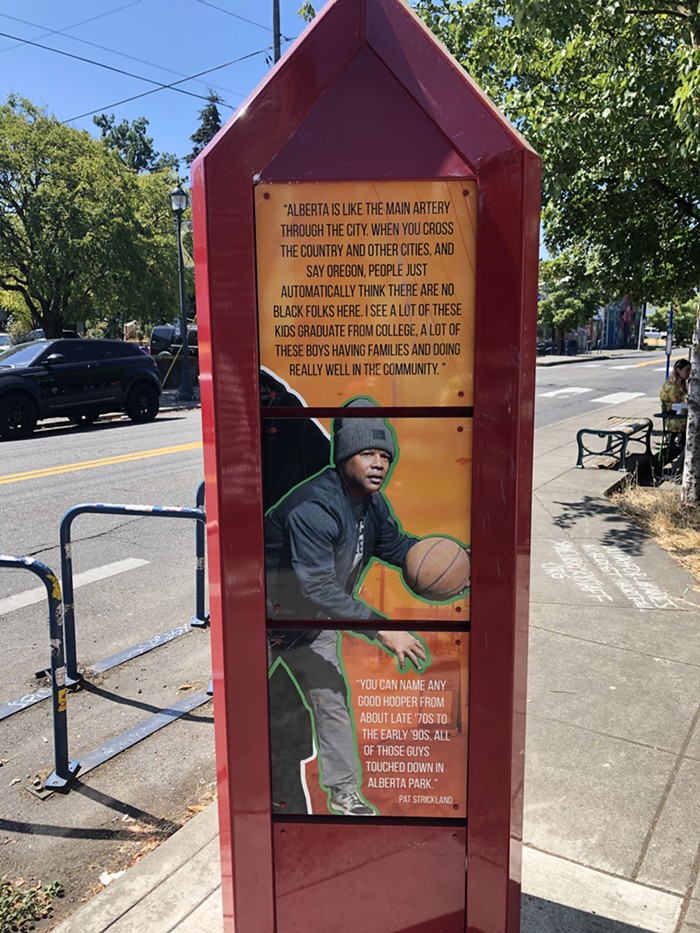
Since the early 2000s the neighborhoods around Alberta have quickly gentrified, especially after the area rebranded itself as the Alberta Arts District. Where once this area brought the surrounding neighborhoods property values down due to its racial makeup and the presence of other so-called undesirables it is now raising property values and seeing a rash of development. Cruelly and ironically this reversal of fortune has spelt disaster for the African-American community surrounding Alberta. As property values rise and new condos, apartments, galleries, and hip businesses move African-Americans have been pushed out of the area, once again being denied the access of social mobility and the building of wealth.
Signpost commemorating African-American history on NE Alberta St. Taken by Abe Asher for The Mercury.
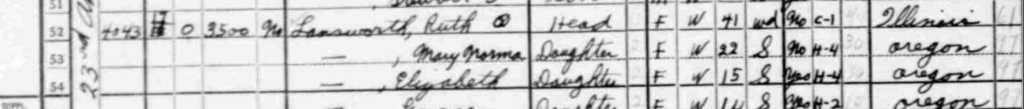
Using the US Census for this project I found that in 1940 this home belonged to the Lansworth family, headed by Ruth, a 41 year old widow, originally from Illinois. Ruth worked in the garment industry, mending hosiery and was raising her 3 daughters: Mary-Norma age 22, Elizabeth age 15, and Grace age 14. I feel a certain joy in knowing that Ruth worked in textiles as my own housemate, Megan, started her own clothing and mending business, Golden Dinosaur, in the front room of our home. It was a connection to the past that stretched some 74 years. I wonder what Ruth would make of her home and her neighborhood all these years later.
Ruth Landsworth and her daughters in the 1940 US Census
My chosen family and I shared this home until 2020. The COVID-19 pandemic upended our plans for living together. Several of us, including myself, lost our jobs due to the lock-down. Our landlords were patient, but ultimately we knew the rent was too high for us to pay with only unemployment and eventually we certain that we would be evicted. We went our separate ways, but we stayed in contact and relatively near each other.
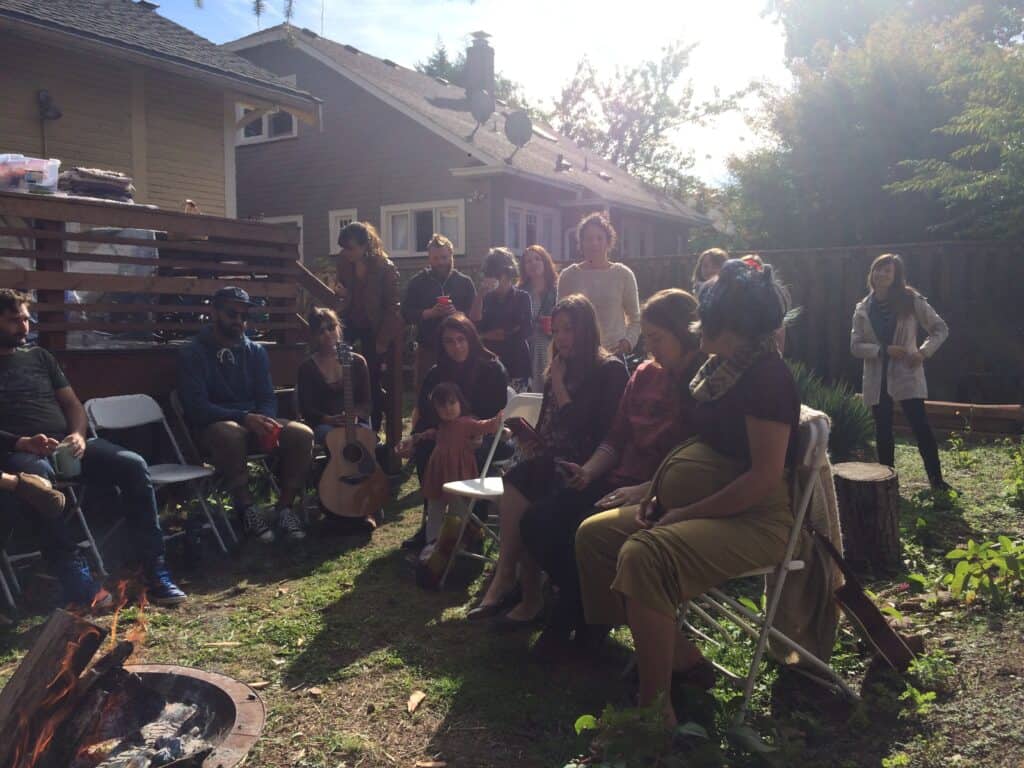
Photo of Our Community in the Backyard of 4023 NE 23rd Avenue. Photo by me.
The target audience for this lesson would be a high school history or civics class. Ideally these students would be building off knowledge the had encountered in their middle school high school classes and would be familiar with political terminology such as: the Left, Far Left, Moderate, Right, Far Right, Authoritarian, Libertarian, etc. However, if students had not encountered these terms in school before this lesson can be used a primer to political analysis.
Content:
Many students understand US politics, both past and present, through the lens of the left-right/democrat-republican dichotomy as it exists on the Political Spectrum. While this is fine for a superficial understanding of American politics it fails to address the complexities that exist. In terms of the Political Spectrum the economics scale and social scale are compressed together; this fails to highlight relationships that exist between different political parties and politicians. Students also tend to rely on their parents for their political ideology; usually placing themselves in either the Democratic or Republican parties. They don’t necessarily understand how their own feelings on economics and social values relate to the political process.
The Political Compass is a way to introduce students to a more holistic view of US politics. For instance, on the economic scale mainstream Democrats and Republicans are much more closely aligned in their policies than say social outlooks. Students will be able to see how both the Democratic and Republican parties, while often depicted at odds on the Spectrum, lean much farther to the Right of economics and towards the Authoritarian end of social scale when taken together. Students through the use of a survey will be able to see how their own views on economics and social values relate to established political parties.
By building on their knowledge of political positions with the introduction of the Political Compass students will be able to see trends in American politics over time, how politicians tend to change over the course of their careers, and how American politics relates to that of other nations.
Process:
Students will do a short Do Now: activity. They will be asked to post anonymously on page 1 of a JamBoard where they believe they fall on the Political Spectrum. Students will see their results in real time. Key Question: How did you feel about placing yourselves on this spectrum? What made this easy or difficult? (3 mins)
Students will be introduced to the Political Spectrum on a PowerPoint. (1 min)
Students will be introduced to the political terminology on a PowerPoint. (4 mins)
Students will be introduced to the Political Compass on a PowerPoint. (2 mins)
Students will be asked to post anonymously on page 2 of the JamBoard from earlier. Key Question: How did you feel about placing yourselves on this on the compass? How did it compare to the spectrum. (3 mins)
Students will be shown on a PowerPoint the presidential candidates of 2016 and 2020 as they appear on the Political Compass. Key Questions: What do you notice about where the Democratic and Republican politicians stand in relation to each other, historical figures and yourself? What similarities or differences are most notable? How might you explain those similarities or differences? (5 mins)