We will share our final projects with one another in short sessions. The creator will briefly share intent – the rest of us will offer peer review and feedback. We will also do our SmartEvals and make plans for our final exit interviews.
When someone clicks on your author tag, they will see all of your posts in reverse chronological order. Think of this post as the introduction to your work.
Be sure to give it a good title and featured image. You might want to think “big picture” here. This will introduce your work to the world.
You should embed a few of your previous post into the “introduction.”
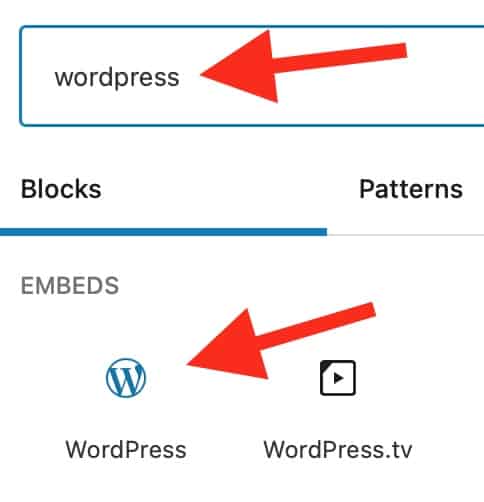
Just search blocks for WordPress. And insert the URL of post you want to embed into block.
Possible prompts:
highlight your final project
also showcase other work you did that you are proud of (could link to specific pages)
your progress – what you thought of the work you did
your approach to teaching / learning history
Here’s a nice example from last fall by Casey Holland
History and other humanities that tended to be narrative are leveraging data collection and display tools to spawn a new digital / data approach to teaching history and social science. In today’s class we will explore some of these exciting web resources.
Class opened with a student-led lesson by Alex Priaulx | Zoom video
We will get an introduction to these sites. Then students will work in teams exploring sites and generating ideas for how they could be used in class. There will also be time for individual meetings with students to report on progress toward final projects.
Assignment
There is no assignment for this class. Students will be working on final projects.
Resources
Nation level data sets
GapMinder World – manipulate moving bubble graphs, select x and y axis from a variety of data sets
Rank Country – insightful world maps and country list data visualizations.
Text-based tools
NGram Viewer – online research tool that allows you to quickly analyze the frequency of names, words and phrases -and when they appeared in the Google digitized books. For more advanced searches using NGram Viewer click here.
Google Trends – see how often specific keywords, subjects and phrases have been queried over a specific period of time.
WordSift was created to help teachers manage the demands of vocabulary and academic language in their text materials.
“Places are locations having distinctive features that give them meaning and character that differs from other locations. Therefore, places are human creations, and people’s lives are grounded in particular places. We come from a place, we live in a place, and we preserve and exhibit fierce pride over places.”
National Geography Standard 4: Place
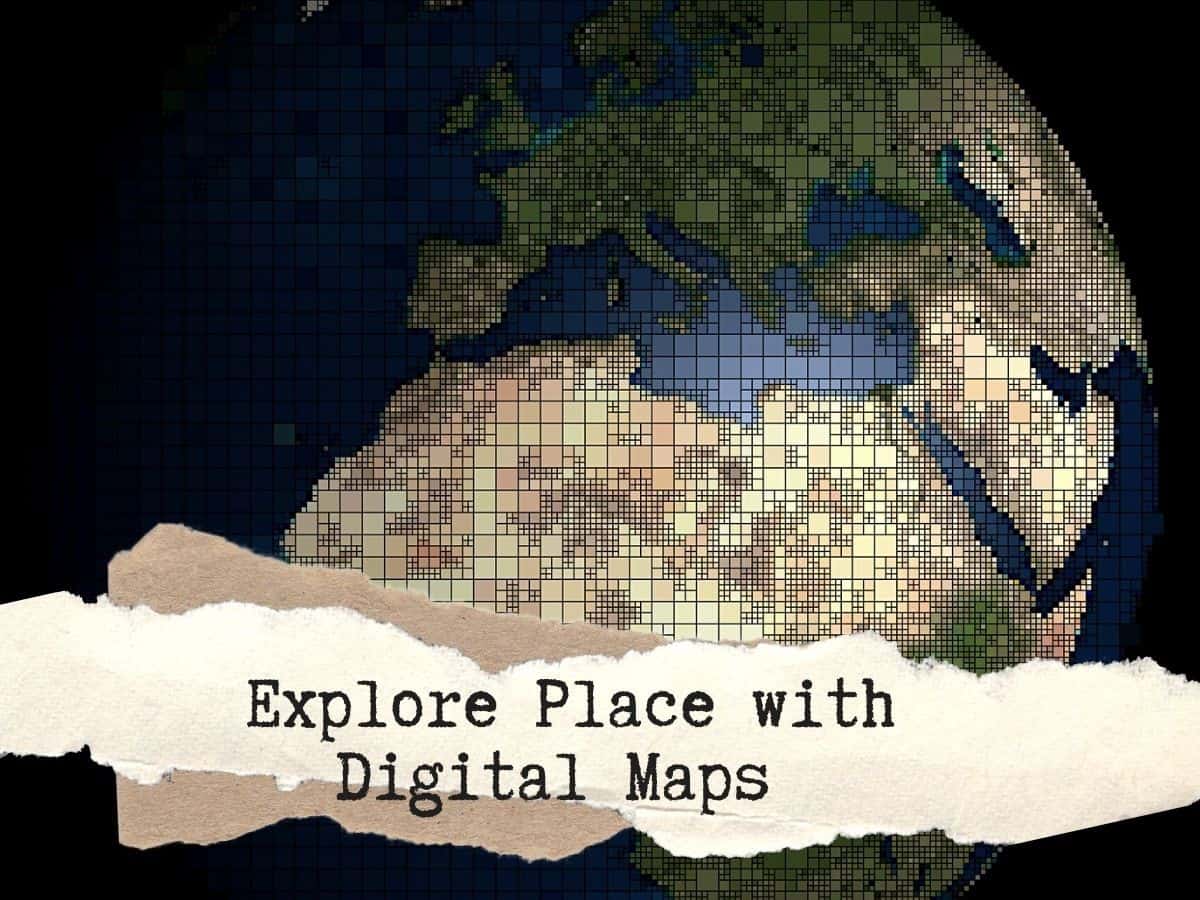
Overview
In today’s class we will explore three mapping tools: Google Tour Creator, StoryMapJS and Google MyMaps . They are easy platforms for teachers and students to create and share interactive maps that can contain additional multi-media content.
Peter will offer a brief intro into each app and students will take an initial look at how to use each app. Students will work in teams to master the app and develop a presentation to share back with the class. We will then generate some ideas for how each app could be used in the classroom.
Assignment: There is no assignment from this class.
Google Tour Creator (a Google project) uses Google’s vast StreetView library as well as additional surround images to to build immersive, 360° tours right from your computer. It can be easily embedded in WordPress or shared via email and social media. Demo tour.
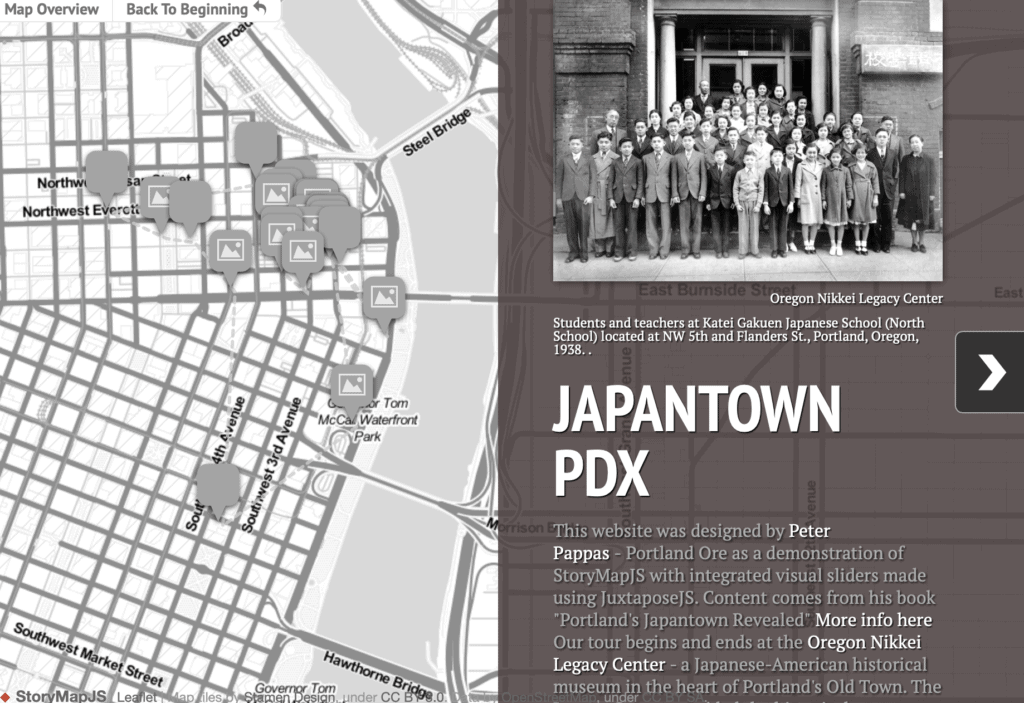
StoryMapJS from Knight Labs is a free tool to help you tell stories on the web that highlight the locations of a series of events. StoryMap JS can pull in media from a variety of sources. Twitter, Flickr, YouTube, Vimeo, Vine, Dailymotion, Google Maps, Wikipedia, SoundCloud, Document Cloud and more!
Keep it short. I recommend not having more than 20 slides for a reader to click through. Pick stories that have a strong location narrative. It does not work well for stories that need to jump around in the map.
Note: it is possible to get an embed code from StoryMapJS. But it does not display well as an embed. Better to get a screenshot and turn it into a hyperlink so viewers can directly view your StoryMap
Google MyMaps is a great tool for visualizing place with a variety of content and locational tools. You can add a variety of content to a MyMap. It can be easily embedded in WordPress or shared via email. MyMaps gets saved in your Google Drive account for easy cataloging. Map below by Jessica Webber.
Resources
Ideas for using Tour Creator and a “how to” below
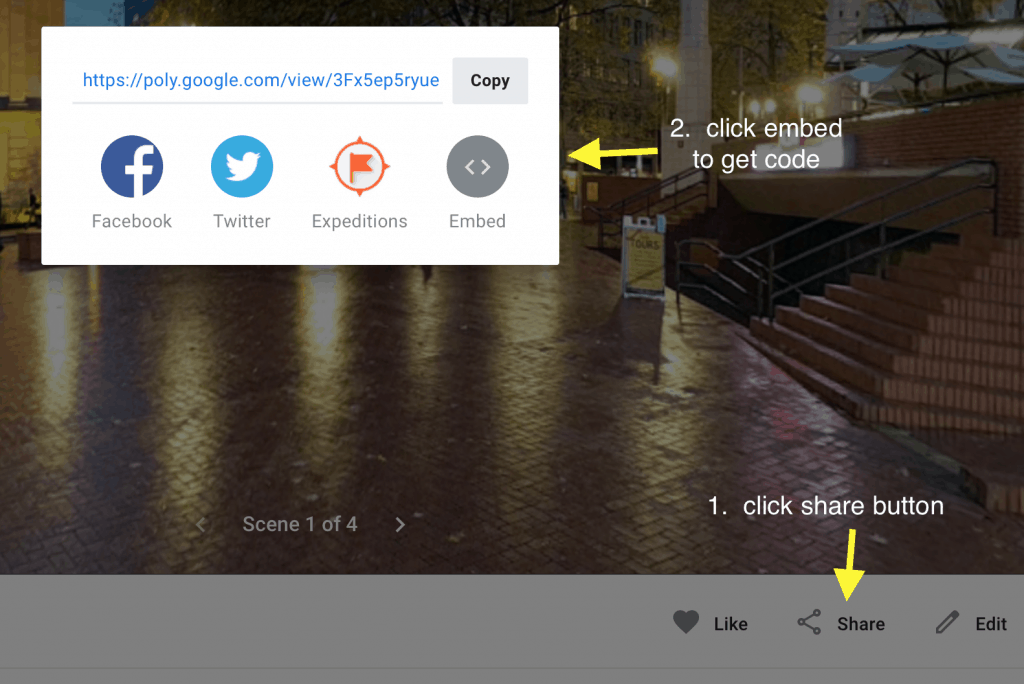
How to get Tour Creator embed code – Once you have published your tour. Click on “View Tour” then follow two steps below to get embed code
Once you have published your tour. Click on “View Tour” then follow two steps above to get embed code
The Detroit Eight Mile Wall is a one-foot-thick , six-foot-high separation wall that stretches about 1⁄2 mile. It was constructed in 1941 to physically separate Black and white homeowners on the sole basis of race. The wall no longer serves to racially segregate homeowners and, as of 1971, both sides of the barrier have been predominately Black. Photo by John Vachon / Library of Congress
Overview
This class will explore the largely forgotten government policies that segregated nearly every major American city and metro area. We will also look at how those unconstitutional actions have fostered inequality in America since their enactment in the 1930s. In preparation for this class students watched the video Segregated by Design.
Students will receive instruction on how to work with this week’s archival websites and there will be an introduction to our final project due on Nov 28th.
Students will use the website Mapping Inequality: Redlining in New Deal America and the 1940 US Census to explore how the “redline” maps created by agents of the federal government’s Home Owners’ Loan Corporation (HOLC) between 1935 and 1940 segregated cities all across America.
HOLC Map of Portland Or
The focus should be on how the “redline” HOLC categories (best, still desirable, definitely declining and hazardous) are reflected in data from the 1940 census. And how those mortgage regulations shaped the lives of people who lived there
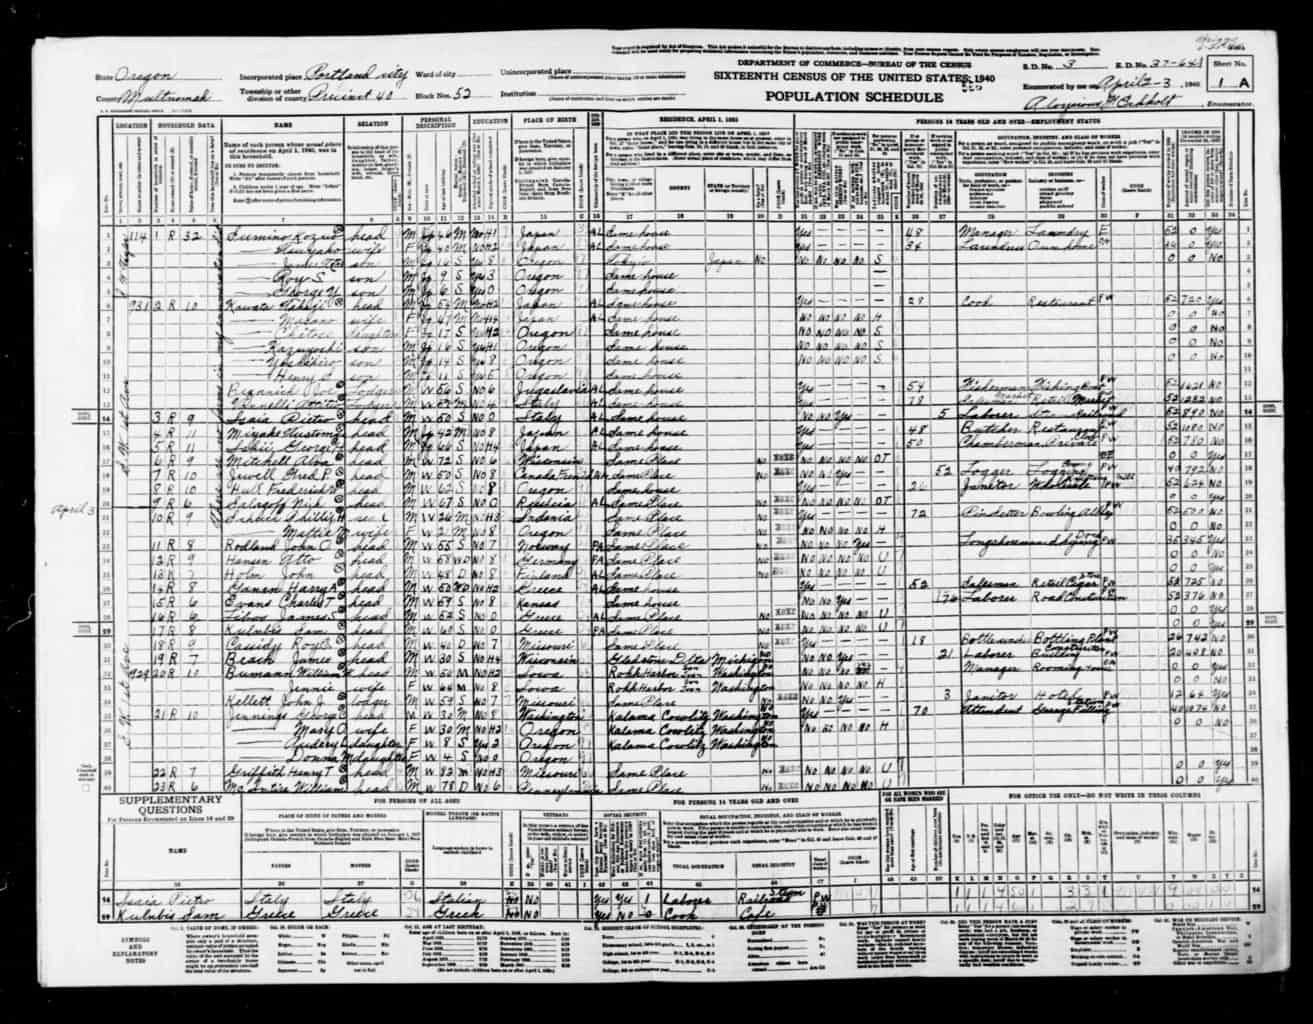
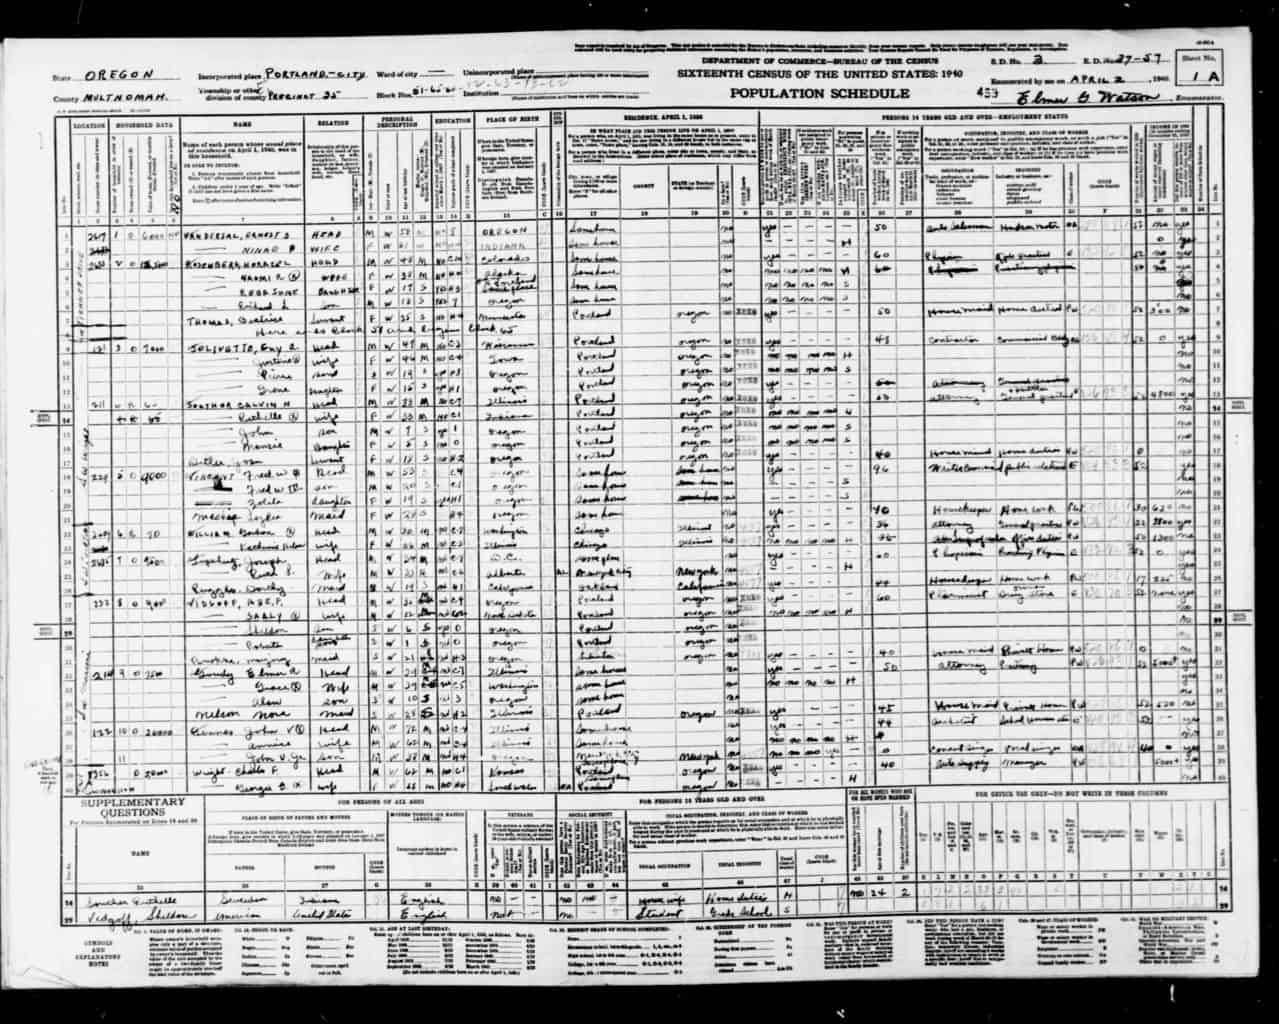
Page from 1940 Census: Portland Oregon SW 1st Ave designated “Hazardous” D8 Southwest River District
Whatever approach you choose, your post should include standard elements – title, featured image, citations / links from public domain content. You may also want to use screen shots from the Mapping Inequality maps or text from the neighborhood descriptions. Or screenshots from the the 1940 census.
This is meant to be a creative exercise – so feel free to explore some options such as:
You could identify neighborhoods in Mapping Inequality and find the data from the corresponding location in the 1940 census. You may want to choose a neighborhood here in Portland or some other city. It could be one you or a family member has lived in.
You could use the Census information to select a few families on that street to “tell their story” using data from the census – names, family members, housing, income, employment, country of birth. Using currency converters you could represent their home value, rent and income in current dollars.
Take a comparative approach – using information from a “Best” and “Hazardous” defined neighborhoods in the same city.
Assume the role of an actual family in the census and tell their story more narratively in the first person and illustrate with images from the era that represent the setting or examples of their type of employment.
If you had a family member who was in the census of 1940 and lived in a neighborhood identified on a HOLC – you could tell their story or what happened to your family since.
Compare neighborhood designation and some Census data 1940 to what the neighborhood is like today (Data from Zillow or Redfin. Which also sometime show interiors of home.)
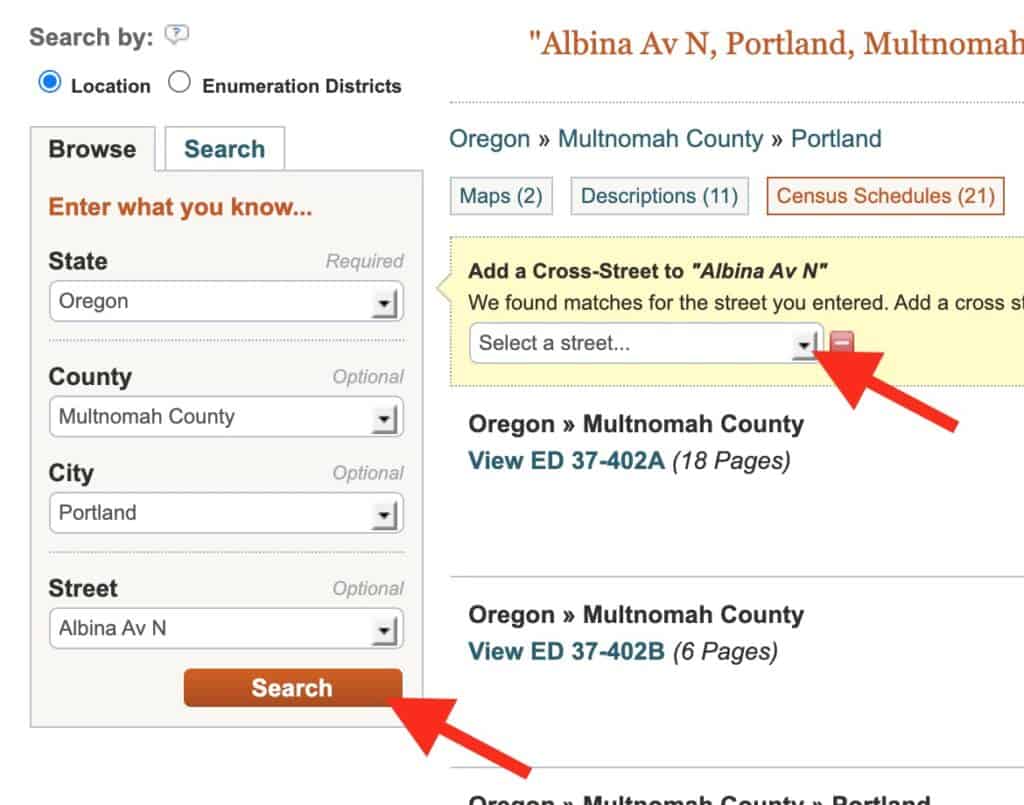
The 1940 census works better in Chrome than Apple Safari.
You will “search by location where the person lived.” Begin by narrow search by state, county, city, street.
After you click search, you have the option to add a cross street.
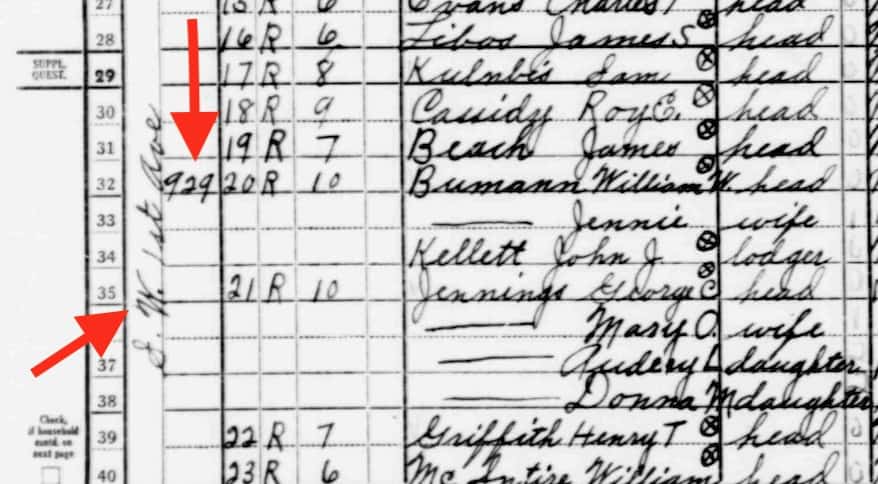
It will take you to multipage document that may not exactly zero in on the intersection you wanted. You may need to scroll through some pages to get to that location. You can find the streets and house numbers on far left. (Street written vertically)


